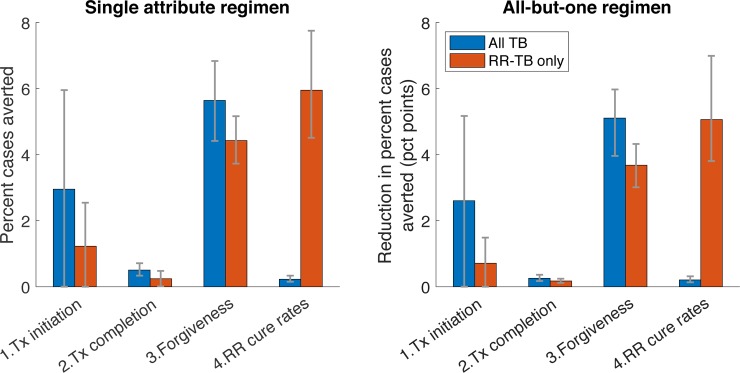
Fig 3. Influence of different regimen properties.
Numbered 'properties' on the x-axis correspond to those listed in Table 1. As described in the main text, we first calculated the 'impact' X of an idealized regimen (percent cases averted between 2022 and 2030), one satisfying all the conditions listed in Table 1 (see Table 3 for impact estimates). We then simulated the impact Y of a 'less-than-ideal' (LTI) regimen: for any given regimen property of interest, we then quantified its 'attributable impact' as (X-Y)/X: that is, the proportional reduction in incidence impact, that results from a regimen failing to meet this criterion. Thus, higher bars represent properties that are more important for epidemiological impact. Red bars show an LTI regimen that meets only one of the regimen requirements in Table 1, while blue bars show an LTI regimen that meets all but one of the regimen requirements.

