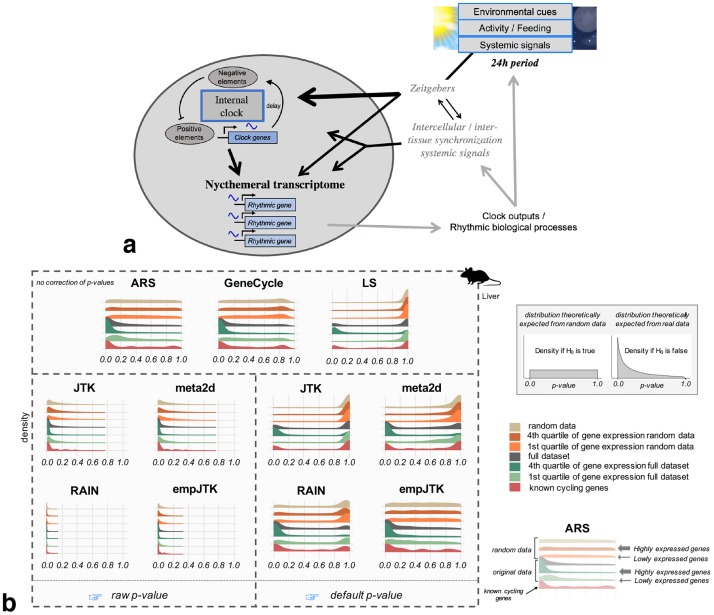
Fig 1. The nycthemeral transcriptome is the group of genes whose mRNAs have periodic variations with a 24h period, called rhythmic genes. To detect these rhythmic genes, we applied seven methods to time-series datasets that produced different density distribution of p-values.
a) Simplified diagram of the entrainment of nycthemeral gene expression. Environmental cues include the light-dark cycle, food-intake, sleep-wake behavior, social activities, or any other 24h periodic event. b) Density distribution of p-values obtained before (raw) and after the default correction (software) for the seven methods applied to mouse liver data (microarray) sub-categorized in: i. randomized data which represents the null hypothesis; ii. randomized data restricted to the first and fourth quartiles of the median gene expression level, to check for the impact of expression level under the null; iii. the full original dataset; iv. the first and fourth quartiles of the median gene expression level of the original data; and v. a subset of known cycling genes (99 genes from KEGG “circadian entrainment” among which we expect a large proportion of rhythmic mRNA accumulation). The default p-values of ARS, GeneCycle, and LS are uncorrected. Mouse image credit to Anthony Caravaggi (license CC BY-NC-SA 3.0).

