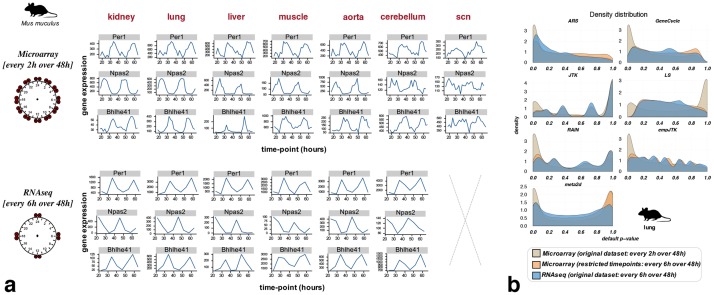
Fig 2. Fewer time points per cycle lead to a weaker detection of rhythmic patterns even if the transcriptome profiling quality is better.
a) Bhlhe41, Npas2, and Per1 expression over time from data of the same mouse experiment [2] using two transcriptome profiling techniques: microarray vs RNAseq. The number of time-points with data is 24 for microarray and 8 for RNAseq. b) The restriction of microarray time-series to the same time-points as in the RNAseq series produces similar p-value distributions to those obtained with RNAseq. This supports a major role of the temporal resolution for method results, relative to a minor role for the difference between RNAseq and microarrays. Mouse image credit to Anthony Caravaggi (license CC BY-NC-SA 3.0).

