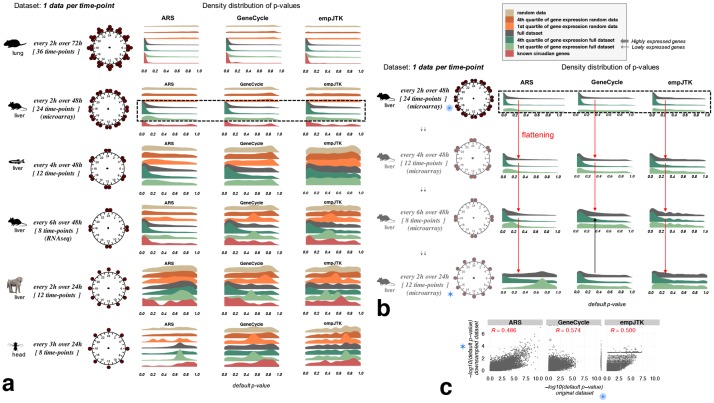
Fig 3. Datasets with one replicate per time-point over a unique cycle of 24 hours do not provide enough information to detect rhythmicity.
Methods lose in statistical power for detecting rhythmic patterns in gene expression when the number of 24h cycles decreases, or when the number of time-points sampled decreases. a) Default p-value distributions obtained for ARS, GeneCycle, and empJTK applied to different datasets and sub-categorized in: i. randomized data which represents the null hypothesis; ii. randomized data restricted to the first and fourth quartiles of the median gene expression level, to check for the impact of expression level under the null; iii. the full original dataset; iv. the first and fourth quartiles of the median gene expression level of the original data; and v. a subset of known cycling genes (8 to 99 genes according to species, see Methods). For each dataset, the number of time-points with data and the temporal resolution is illustrated around a 24h clock. For the same number of time-points, performance seems better with two cycles than only one cycle (zebrafish vs baboon). b) The reduction of the number of time-points of the mouse liver microarray dataset shows increasingly weak rhythm detection by ARS, GeneCycle, and empJTK, shown by a flattening of the p-value distribution on the full dataset (red arrow). GeneCycle showed no difference between a few time-points over two cycles or more time-points over a single cycle (black arrow). c) Scatter-plots of p-values obtained before and after down-sampling (every 2h over 48h vs. every 2h over 24h) for the full dataset. Each point is a gene. R is the Pearson correlation; p-value < 2.2e–16 in all cases. After down-sampling, the rhythmic signal is retrieved for the same genes. Images credit: Anthony Caravaggi (mouse), Ian Quigley (zebrafish), wikipedia GNU GPL Muhammad Mahdi Karim (baboon), and Public Domain for other images (from PhyloPic).

