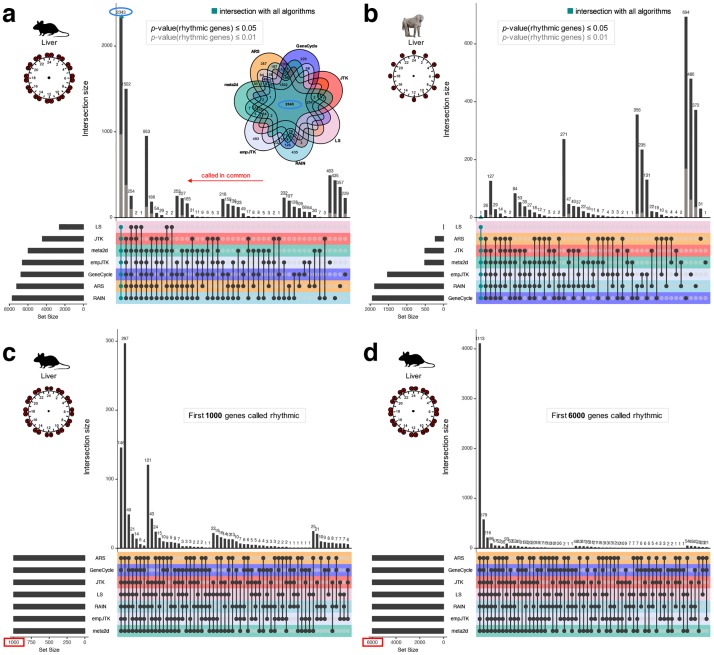
Fig 4. Methods detect the same first top rhythmic genes, but with inconsistencies in the meaning of their p-values.
Upset diagrams show the number of rhythmic genes called in common by the methods. Each intersection is exclusive, i.e. one gene can appear in only one intersection. (a,b) Upset diagram for mouse liver dataset (microarray) (a) and baboon liver dataset (b) for the p-value thresholds of 0.05 (black) or 0.01 (grey) for calling genes rhythmic. The Venn diagram (a) illustrates the upset diagram with, for instance, 2343 genes called rhythmic by all methods. (c,d) Upset diagram for mouse liver dataset (microarray) for the first 1000 (c) or 6000 (d) genes detected rhythmic for each method. With a smaller number of top rhythmic genes, the overlap between methods is weaker. Images credit: Anthony Caravaggi (mouse) and wikipedia GNU GPL Muhammad Mahdi Karim (baboon).

