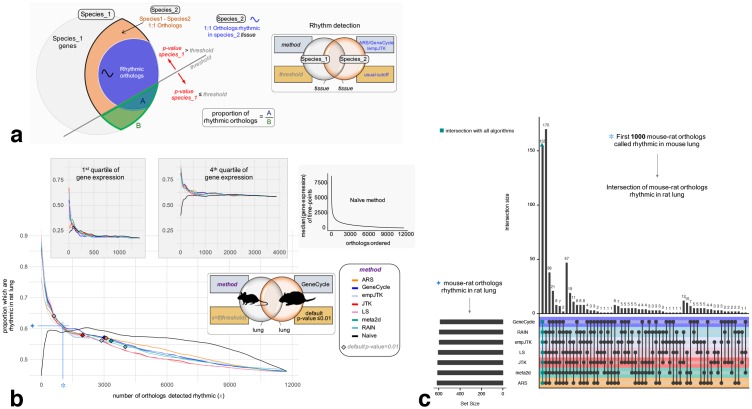
Fig 6. Only strong rhythmic signals of gene expression are relevant.
Methods designed for rhythm detection in gene expression show an advantage only for the genes with a strong rhythmic signal, i.e. related to very small p-values. For a fixed number of top genes called rhythmic, all the methods, despite their design differences, retrieve approximately the same proportion of biologically functional rhythmic genes and the same genes themselves. a) Method to obtain figure b: For a given p-value threshold, each method detects a certain number of rhythmic genes (genes with p-value ≤ threshold). At each threshold, we calculate the proportion of orthologs rhythmic in species2 (A) among one-to-one species1-species2 orthologs (B). The benchmark set is composed of one-to-one orthologs detected rhythmic in the second species (using method ARS, GeneCycle, or empJTK), called rhythmic orthologs. b) Variation of the proportion rhythmic orthologs/all orthologs in mouse as a function of the number of mouse orthologs detected rhythmic, for each method applied to the mouse lung dataset. The benchmark gene set is composed of mouse-rat orthologs, detected rhythmic in rat lung by the GeneCycle method with default p-value ≤ 0.01. The black line is the Naive method which orders genes according to their median expression levels (median of time-points), from highest expressed to lowest expressed gene, then, for each gene, calculates the proportion of rhythmic orthologs among those with higher expression. The proportion of the benchmark set among one-to-one orthologs is higher for highly expressed genes (4th quartile) than for lowly expressed genes (1st quartile) (∼60% vs ∼20% respectively). Diamonds correspond to a p-value threshold of 0.01. c) Upset diagram showing the number of rhythmic orthologs (figure a) called in common by the methods among the first 1000 mouse-rat orthologs that are called rhythmic in mouse lung. Images credit: Anthony Caravaggi (mouse) and Public Domain for other images (from PhyloPic).

