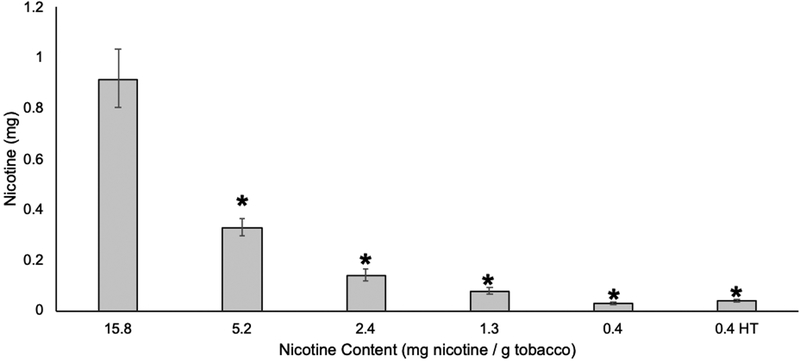
Figure 1. Mouth level nicotine intake.
Mouth level nicotine intake and 95% confidence intervals calculated using solanesol deposited in cigarette butts collected during Week 6 of clinical trial (n=51–70 participants / group). * denotes significant reduction in mouth level nicotine intake compared to control group (15.8 mg nicotine / g tobacco). HT=high tar

