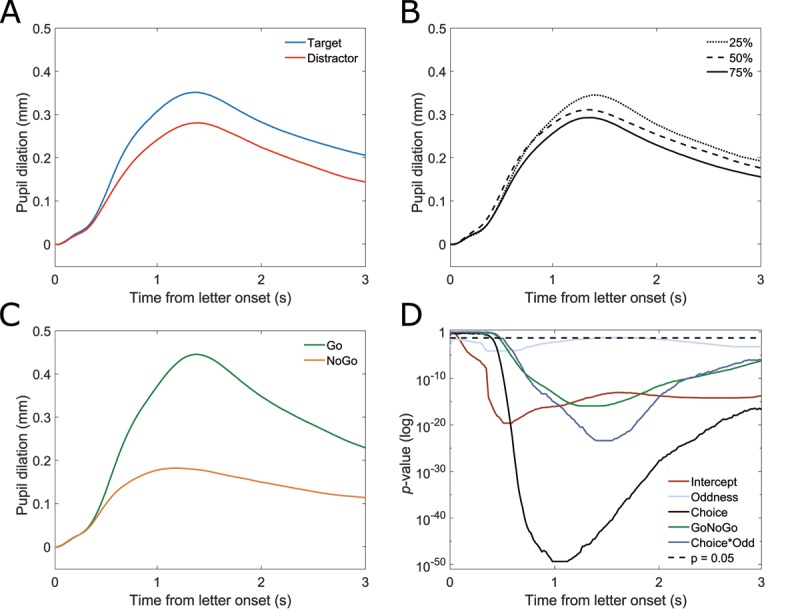
Figure 2.

A–C: Pupil dilation over time against local baseline. A: target (blue) and distractor (red). B: stimulus probabilities: 25% (dotted), 50% (dashed), and 75% (solid). C: Go (green) and NoGo (yellow). D: p-values for a functional linear mixed model over time. Choice: dark grey, stimulus probability (oddness): light blue, GoNoGo: green, choice*stimulus probability: dark blue, intercept: light brown, α = 0.05: dashed black. Based on n = 44 participants and n = 13551 individual trials.
