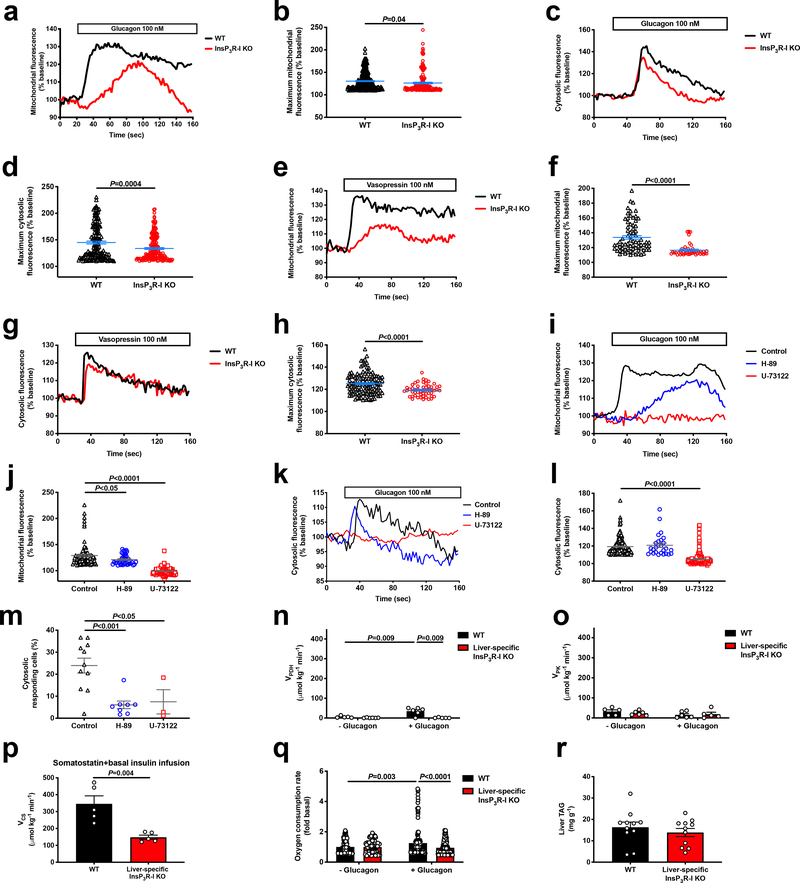
Extended Data Figure 6.
Glucagon stimulates mitochondrial oxidation through hepatocellular calcium signaling. (a) Representative mitochondrial response to glucagon, which was added where denoted by the “glucagon” bar. (b) Maximum mitochondrial response to glucagon (n=324 WT and 167 KO). Groups in panels b, d, f, and h were compared by the 2-tailed unpaired Student’s t-test. (c) Representative cytosolic response to glucagon. (d) Maximum cytosolic response to glucagon (n=146 WT and 175 KO). (e) Representative mitochondrial response to the InsP3R agonist vasopressin. (f) Amplitude of the cytosolic response to vasopressin (n=73 WT and 42 KO). (g) Representative cytosolic response to vasopressin. (h) Amplitude of the cytosolic response to vasopressin (n=119 WT and 53 KO). (i) Representative mitochondrial responses to glucagon (added where denoted by the bar) in WT hepatocytes incubated in the PKA inhibitor H-89 or the PLC inhibitor U-73122. (j) Amplitude of the mitochondrial response (n=79 control, 39 H-89, and 127 U-73122). Groups were compared to the control in panels j and l, and m using the 2-tailed unpaired Student’s t-test. (k) Representative cytosolic responses to glucagon±H-89 or U-73122. (l) Amplitude of the cytosolic response (n=182 control, 27 H-89, and 187 U-73122). (m) Percentage of cells with a cytosolic response (>110% baseline) to glucagon±H-89 or U-73122 (n=11 control, 8 H-89, and 3 U-73122). (n)-(o) Hepatic PDH and PK flux in vivo (n=5 WT-glucagon, 6 WT+glucagon, 6 KO-glucagon, 5 KO+glucagon). In panels n-o, groups were compared (with vs. without glucagon, and WT vs. KO) using the 2-tailed unpaired Student’s t-test. (p) Liver VCS in mice infused with somatostatin, basal insulin, and glucagon (n=5). (q) In vitro oxygen consumption in isolated hepatocytes incubated±100 nM glucagon (n=113 WT-glucagon, 144 KO-glucagon, 149 WT+glucagon, 210 KO+glucagon). (r) Liver triglyceride content (without glucagon infusion) (n=11). In all panels, if no statistical comparison is denoted, the groups were not significantly different. Error bars represent the S.E.M.

