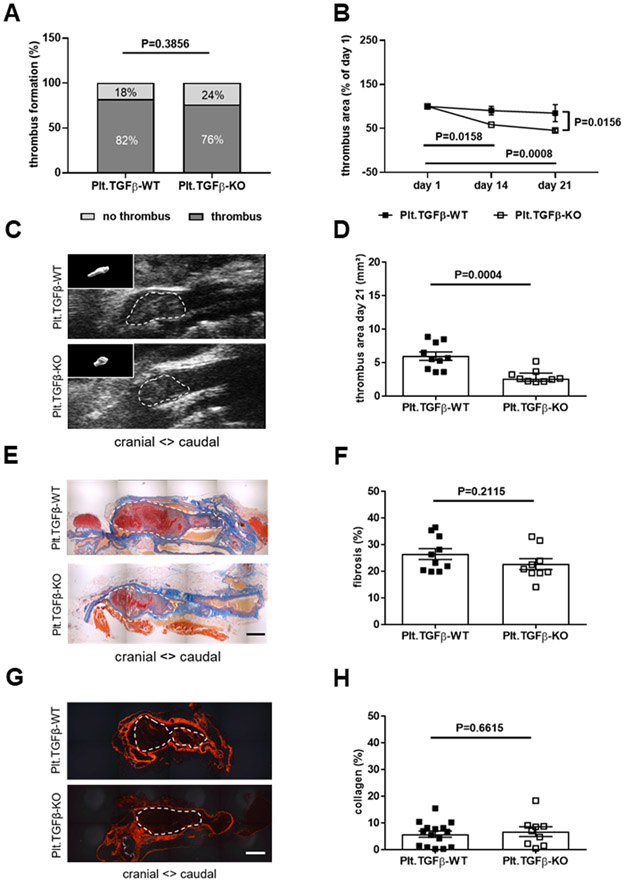
Figure 1. Platelet-specific deletion of TGFβ1 and venous thrombus resolution.
The percentage of mice that formed a venous thrombus on day 1 after IVC ligation is shown (A). Thrombus resolution (B) and thrombus area at day 21 after IVC ligation (C, D) were measured by ultrasound in Plt.TGFβ-WT (n=10) and Plt.TGFβ-KO (n=9) mice. In panel B, thrombus area at day 21 is expressed relative to thrombus area at day 1 after surgery. In panel C, representative ultrasound snapshots of thrombosed IVC segments in Plt.TGFβ-WT and Plt.TGFβ-KO mice at day 21 after IVC ligation are shown (with 3-dimensional thrombus reconstruction as insert). Representative pictures of longitudinal cross-sections through the thrombosed IVC at day 21 after ligation following Carstairs’ staining (E) and quantification of thrombofibrosis (blue signal) (n=10 Plt.TGFβ-WT and n=9 Plt.TGFβ-KO mice; F). Representative pictures after Sirius red stain (G) and quantification of interstitial collagen (red signal) (n=15 for Plt.TGFβ-WT and n=9 for Plt.TGFβ-KO mice; H). Exact p-values, as determined by χ2 test in (A), Two-Way ANOVA followed by Bonferroni’s multiple comparisons test (3 comparisons per genotype) in (B; non-significant p-values are not shown), Mann-Whitney test in (D) and Student’s t-test in (F) and (H), are shown in the graphs. Scale bars in (E) and (G) represent 200 μm.

