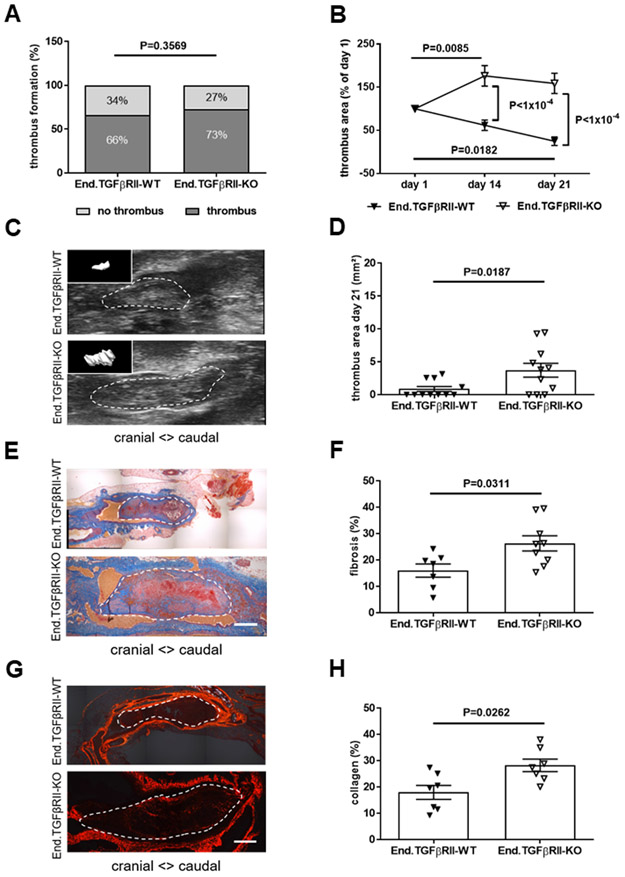
Figure 2. Endothelial-specific deletion of TGFβRII and venous thrombus remodeling.
The percentage of mice that formed a venous thrombus on day 1 after IVC ligation is shown (A). Thrombus resolution (B) and thrombus area (C, D) measured by ultrasound at day 21 after IVC ligation in End.TGFβRII-WT and End.TGFβRII-KO mice (n=11 mice per group). In panel B, thrombus area at day 14 and 21 is expressed relative to thrombus area at day 1. In panel C, representative ultrasound snapshots of thrombosed IVC segments in End.TGFβRII-WT and End.TGFβRII-KO mice at day 21 after IVC ligation shown (with 3-dimensional thrombus reconstruction as insert). Representative pictures of longitudinal cross-sections through the thrombosed IVC at day 21 after ligation following Carstairs’ staining (E) and quantification of thrombofibrosis (blue signal) (n=7 End.TGFβRII-WT and n=9 End.TGFβRII-KO mice; F). Representative pictures after Sirius red stain (G) and quantification of interstitial collagen (red signal) (n=7 mice per group; H). Exact p-values, as determined by χ2 test in (A), Two-Way ANOVA followed by Bonferroni’s multiple comparisons test (3 comparisons per genotype) in (B; non-significant p-values are not shown), and Mann-Whitney test in (D, F and H) are shown in the graphs. Scale bars represent 200 μm.

