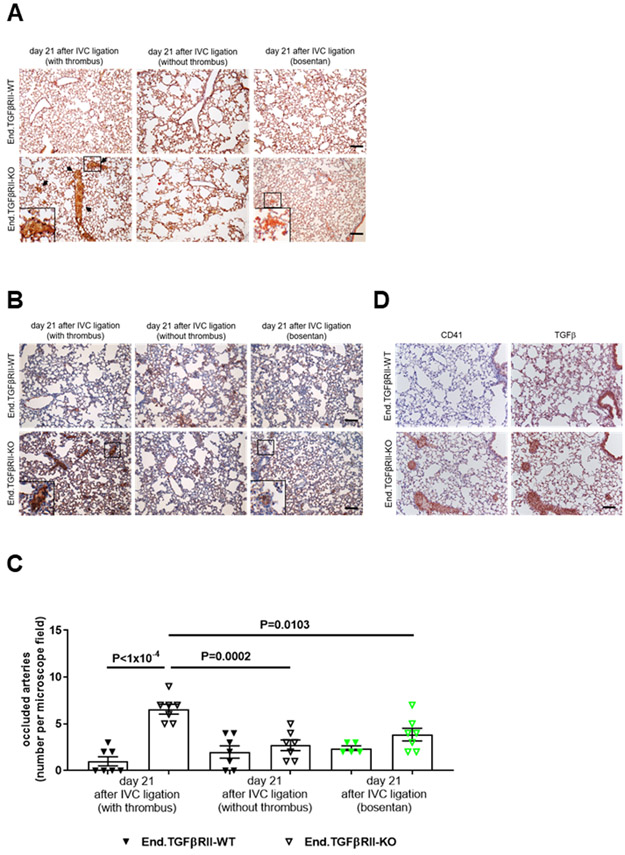
Figure 3. Detection of pulmonary vascular occlusions following venous thrombosis.
Representative images after analysis of pulmonary artery obstructions in PBS- and formalin-infused paraffin-embedded mouse lungs from End.TGFβRII-WT and End.TGFβRII-KO mice at day 21 after IVC ligation using Carstairs’ staining (A; arrows) or immunostaining of fibrinogen (B). Mice that developed a venous thrombus at day 1 and mice without a thrombus were examined separately to distinguish pulmonary embolization and in situ thrombosis (n=7 mice per group). End.TGFβRII-KO mice treated with bosentan over 3 weeks were also examined (marked in green; n=5 End.TGFβRII-WT and n=7 End.TGFβRII-KO mice). Scale bars represent 10 μm. The results of the quantitative analysis of red, fibrin-rich material (arrows in A) in the pulmonary parenchyma are shown (C). Exact p-values, as determined by One-Way ANOVA followed by Bonferroni’s multiple comparisons test (7 comparisons) are shown in panel C. Non-significant p-values are not shown. Representative images of lungs from End.TGFβRII-WT and End.TGFβRII-KO mice at day 21 after IVC ligation showing results after immunostaining for the platelet marker CD41 and TGFβ1. Scale bar represent 10 μm.

