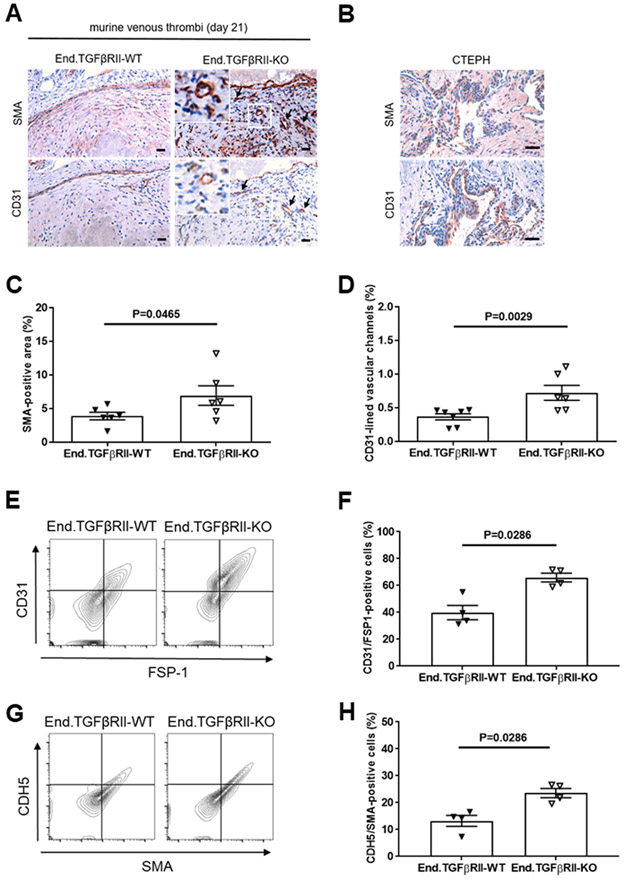
Figure 4. Presence of myofibroblasts and endothelial cells in chronic venous thrombi of End.TGFβRII mice.
Representative images and quantitative analysis of the SMA-immunopositive area (A, C) and vascular channels lined by CD31-immunopositive cells (A, D) in 21-days-old venous thrombi of End.TGFβRII-WT (n=6 in C and n=7 in D) and End.TGFβRII-KO mice (n=6). Data shown in panel D represent the area lined by CD31-positive channels per total thrombus area (%). Scale bars represent 10 μm. Cells expressing endothelial and myofibroblast markers are highlighted by black arrows. Representative images of SMA- and CD31-immunopositive cells in vessel-rich regions of PEA tissue specimens from patients with CTEPH are shown in (B). Scale bars represent 100 μm. Representative flow cytometry dot blots after analysis of 21-days-old venous thrombi for the number of cells double-positive for CD31 and FSP1 (n=4 mice per group; E, F) or CDH5 and SMA (n=4 mice per group; G, H). Exact p-values, as determined by Mann-Whitney test, are shown in panels C, D, F and H.

