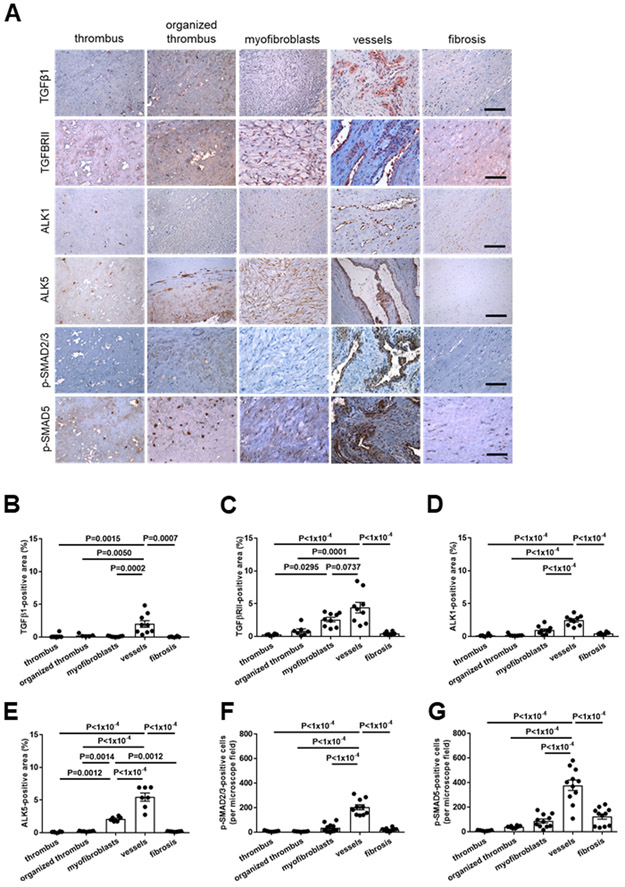
Figure 5. Expression of TGFβ1, its receptors and downstream signaling mediators in pulmonary endarterectomy specimens of patients with CTEPH.
Representative images in regions primarily containing fresh or organized thrombus, myofibroblasts, vessels or fibrosis (A) and the results of the quantitative analysis after immunohistochemical analysis of the expression of TGFβ1 (B), TGFβRII (C), TGFβRI/ALK1 (D), TGFβRI/ALK5 (E), p-SMAD2/3 (F) and p-SMAD5 (G) in PEA samples from n=9 CTEPH patients are shown. Scale bars represent 100 μm. Exact p-values, as determined by One-Way ANOVA followed by Bonferroni’s multiple comparisons test (10 comparisons), are shown in panels B-G. Non-significant p-values are not shown.

