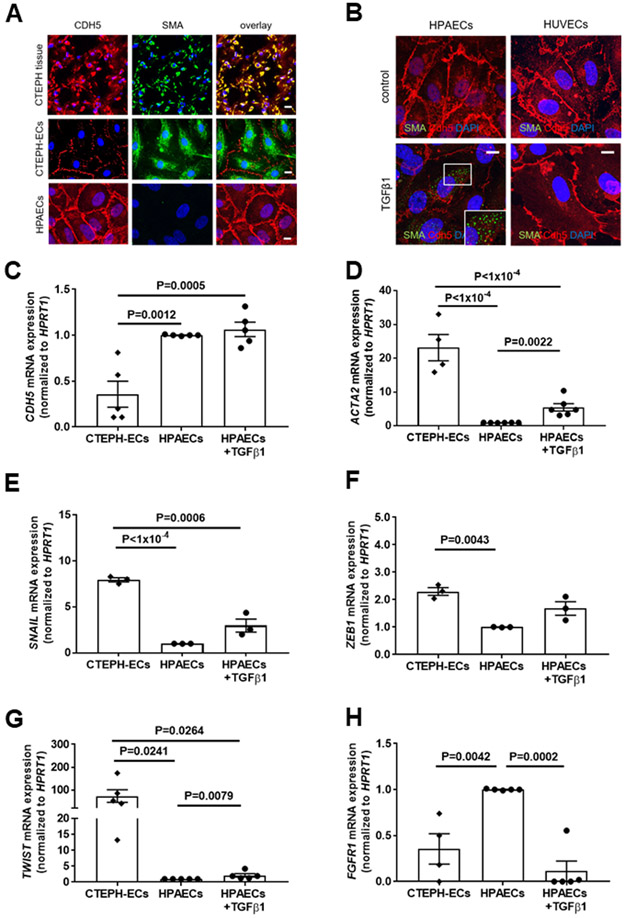
Figure 6. Expression of endothelial and mesenchymal markers in primary human pulmonary endothelial cells from patients with CTEPH: comparison to TGFβ1 stimulation.
Representative pictures after immunofluorescence confocal microscopy for VE-cadherin (CDH5) and SMA in CTEPH tissue specimens, endothelial cells outgrown from CTEPH tissue (CTEPH-ECs) and HPAECs (A). Representative confocal pictures for CDH5 and SMA in HPAECs and HUVECs with and without TGFβ1 stimulation (10 ng/ml for 7 days) to induce EndMT (B). Quantitative analysis of CDH5 (n=5 biological replicates; C), SMA (ACTA2; n=4 for CTEPH and n=6 for all others; D), SNAIL (n=3; E), ZEB1 (n=3; F), TWIST (n=5; G) and FGFR1 (n=4 for CTEPH and n=5 for all others; H) mRNA expression in HPAECs with and without TGFβ1 stimulation (10 ng/mL for 7 days) and CTEPH-ECs. Scale bars represent 10 μm. Exact p-values, as determined by One-Way ANOVA followed by Bonferroni’s multiple comparisons test (3 comparisons) and by Mann-Whitney test for the comparison of HPAECs with and without TGFβ1 stimulation, are shown in panels C-H. Non-significant p-values are not shown.

