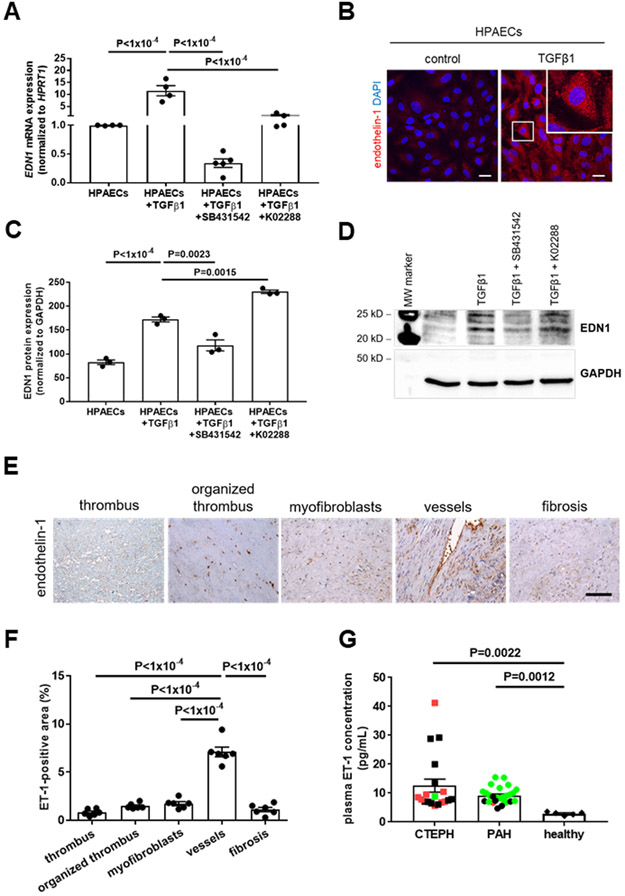
Figure 7. Endothelin-1 expression in primary human pulmonary endothelial cells and in patients with CTEPH: effect of TGFβ1.
Quantitative real time PCR (n=4 biological replicates; A) and western blot analysis (n=3 biological replicates; C) of endothelin-1 (EDN1) mRNA or protein expression in HPAECs treated with TGFβ1 (10 ng/mL for 7 days). A representative western blot membrane is shown in (D). In some experiments, SB431542 (10 μM) was added to block ALK5 or K02288 (10 μM) to block ALK1 dependent signaling. Exact p-values, as determined by One-Way ANOVA followed by Bonferroni’s multiple comparisons test (4 comparisons), are shown in panels A and C. Data are normalized to HPRT1 and are expressed as -fold change vs. HPAECs (set at 1). Representative confocal pictures of HPAECs treated with TGFβ1 after immunodetection of endothelin-1 (ET-1; B). Scale bars represent 10 μm. Analysis of ET-1 expression in human n=6 PEA specimens primarily containing fresh or organized thrombus, myofibroblasts, vessels or fibrosis. Representative pictures (E) and the results of the quantitative analysis (F) are shown. Scale bar represents 100 μm. Exact p-values, as determined by One-Way ANOVA followed by Bonferroni’s multiple comparisons test (10 comparisons), are shown in panel F. Plasma levels of ET-1 in patients with CTEPH (n=19) or PAH (n=26) and healthy individuals (n=5; G). Patients who received endothelin receptor antagonists are marked in green, patients who received soluble guanylate cyclase stimulators are marked in red. Exact p-values, as determined by Kruskall-Wallis test followed by Dunn’s multiple comparisons test (3 comparisons), are shown in panel G. Non-significant p-values are not shown.

