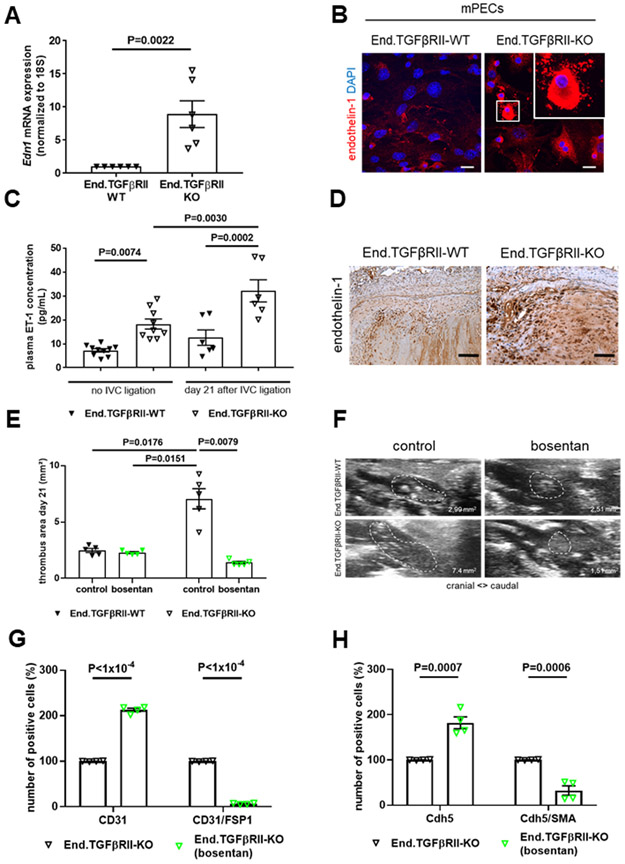
Figure 8. Endothelin-1 expression in mouse pulmonary endothelial cells or venous thrombi and effects of endothelin receptor antagonization on EndMT.
Quantitative real time PCR analysis (A) and representative confocal pictures (B) after analysis of endothelin-1 (EDN1) mRNA or protein expression in mPECs isolated from End.TGFβRII-WT and End.TGFβRII-KO mice and cultured in MV2 medium. Exact p-values, as determined by Mann-Whitney test are shown (n=6 biological replicates). Data are normalized to 18S and are expressed as -fold change vs. End.TGFβRII-WT mice (set at 1). Scale bars represents 10 μm. Plasma levels of ET-1 in samples from End.TGFβRII-WT and End.TGFβRII-KO mice uninjured (no IVC ligation; n=10 per group) and 21 days after IVC ligation (n=6 per group). Exact p-values, as determined by One-Way ANOVA followed by Bonferroni’s multiple comparisons test (4 comparisons), are shown. Non-significant p-values are not shown. Representative images of endothelin-1 protein expression in thrombosed vein wall segments 21 days after IVC ligation of End.TGFβRII-WT and End.TGFβRII-KO mice (D). Scale bars represent 10 μm. Quantitative analysis of thrombus area at day 21 after IVC ligation in End.TGFβRII-WT and End.TGFβRII-KO controls and mice treated with bosentan (n=5 per group; 5 mg/kg BW; E). Representative ultrasound images are shown in (F). Quantitative flow cytometry analysis of CD31- and CD31/FSP1 (n=4 per group; G) or CDH5- and CDH5/SMA (n=4 per group; H) double-positive cells residing within 21 day-old thrombi of End.TGFβRII-KO control- and bosentan-treated mice. Results in mice treated with bosentan are labeled in green. Exact p-values, as determined by Two-Way ANOVA followed by Bonferroni’s multiple comparisons test (6 comparisons; E) and multiple t test (G and H), are shown. Non-significant p-values are not shown.

