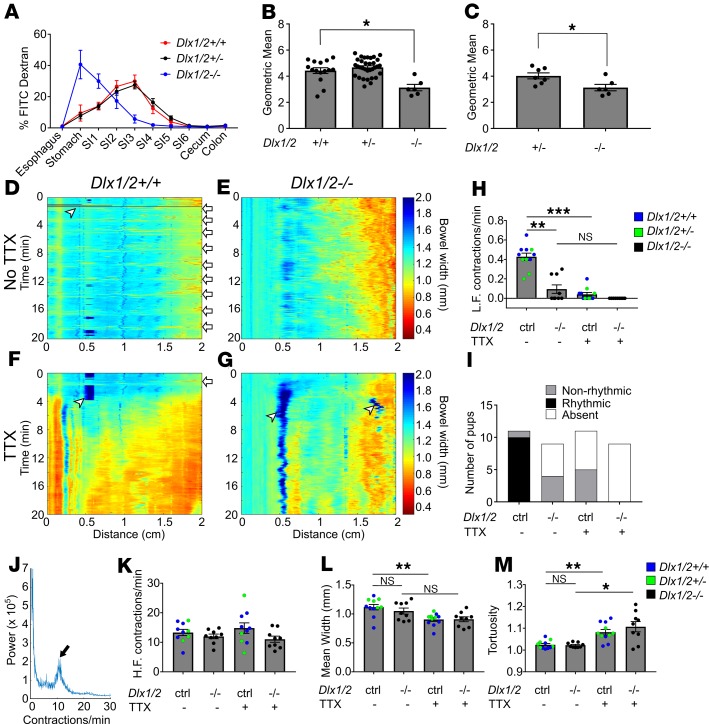
Figure 2. Dlx1/2–/– mice have abnormal bowel motility.
(A) Percentage FITC-dextran in distinct bowel regions 3 hours after oral FITC administration. SI1 to SI6 indicate sequential small intestine (SI) segments. (B) Weighted average of FITC bowel transit, represented by geometric mean, shows significant delays in transit for P0 Dlx1/2–/– mice, but not for heterozygous Dlx1/2+/– mice (P = 0.0188; Kruskall-Wallis with Dunn’s multiple-comparisons test; n = 15 [+/+], 33 [+/–], 6 [–/–]). (C) A subset of heterozygotes spontaneously accumulated bowel air, but transit in Dlx1/2–/– mutants was still slower than in Dlx1/2+/– mice. (P = 0.0228; Student’s t test; n = 7 [+/–], n = 6 [–/–]). (D–G) Representative kymographs depicting bowel width (color axis) over time (y axis) at specific distances along the SI (x axis) in control and Dlx1/2–/– bowels in the absence (D and E) or presence (F and G) of tetrodotoxin (TTX). White arrows indicate contraction complexes in control mice, but similar contraction complexes could not be identified in Dlx1/2–/– bowel; white arrowheads indicate artifacts such as air bubbles on the surface of bowel. (H) Dlx1/2–/– mice had fewer low-frequency (L.F.) contraction complexes than controls (P = 0.0055; Kruskal-Wallis with Dunn’s multiple-comparisons test; n = 10 [ctrl], n = 9 [–/–]). (I) Low-frequency contraction complexes generally occurred in rhythmic patterns in controls but not in mutants. (J) Representative Fourier plot from control mouse, with black arrow highlighting peak contraction frequency for TTX-insensitive contractions; note that contraction frequency for neurally mediated contractions is too low to be reliably identified on the Fourier graph. (K) High-frequency (H.F.) TTX-insensitive contractions occurred at normal rates in Dlx1/2–/– mice (P = 0.181; 1-way ANOVA; n = 10 [ctrl], n = 9 [–/–]). (L and M) In controls, average bowel width decreased significantly with addition of TTX (L; P = 0.0043; 1-way ANOVA with Tukey’s multiple-comparisons test), while tortuosity increased with TTX (M; P = 0.0087; Kruskal-Wallis with Dunn’s multiple-comparisons test). In mutants, bowel width did not significantly change with TTX addition (L; P = 0.1423), but tortuosity increased with TTX (M; P = 0.0276). *P < 0.05; **P < 0.01; ***P < 0.001. Error bars represent SEM. NS, not significant.

