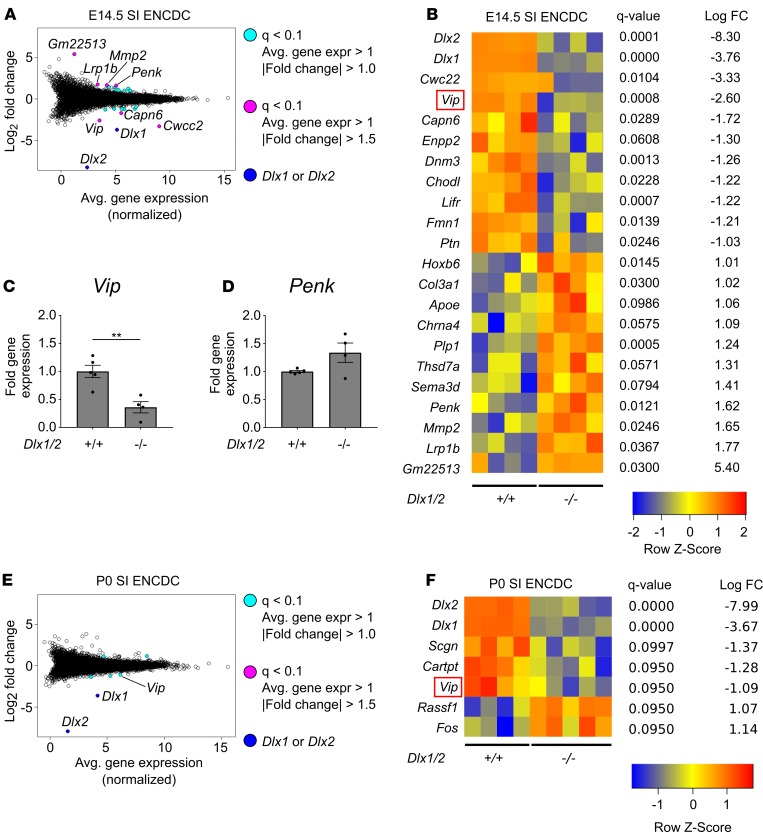
Figure 7. Vip levels are reduced in the developing ENS of Dlx1/2–/– mice at E14.5 and P0.
(A) Bland-Altman plot of differentially expressed genes in Dlx1/2–/– versus WT E14.5 FACS-isolated small intestine (SI) ENCDCs after RNA-seq. (B) Heatmap of differentially expressed genes shows 20 dysregulated genes in Dlx1/2–/– ENS at E14.5, in addition to Dlx1 and Dlx2, which were substantially decreased in mutant mice. (C and D) Quantitative RT-PCR was performed for Vip (C) and Penk (D) mRNA on independent samples to validate expression patterns for these neurotransmitters in E14.5 mouse ENS (Vip, P = 0.0042, Student’s t test, n = 5 [+/+], n = 4 [–/–]; Penk, P = 0.0634, Student’s t test, n = 5 (+/+), n = 4 [–/–]). (E) Bland-Altman plot of differentially expressed genes in Dlx1/2–/– versus WT P0 FACS-isolated ENCDCs after RNA-seq. (F) Heatmap of differentially expressed genes shows 5 dysregulated genes in Dlx1/2–/– ENS at P0, in addition to Dlx1 and Dlx2. **P < 0.001.

