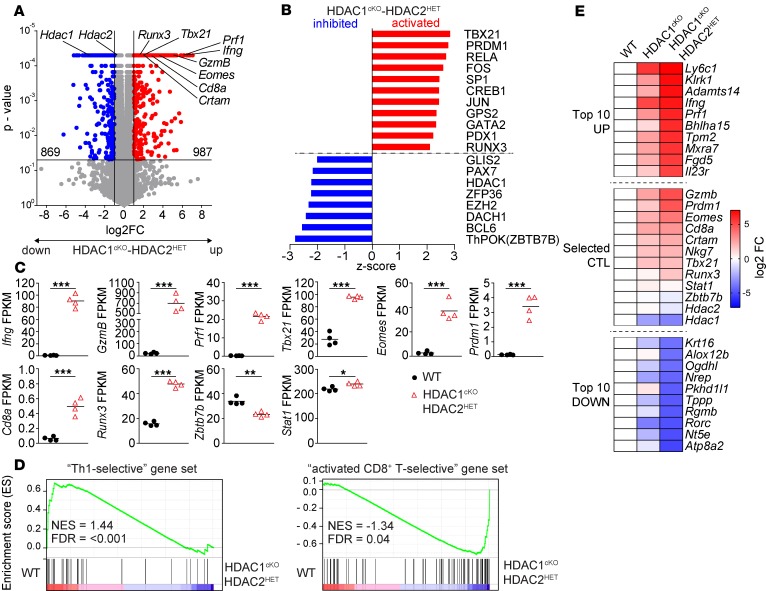
Figure 2. Induction of a CD4+ CTL signature in activated HDAC1cKO-HDAC2HET CD4+ T cells.
Naive WT and HDAC1cKO-HDAC2HET CD4+ T cells were activated with anti-CD3/anti-CD28 for 3 days in the presence of IL-2. RNA was isolated from sorted viable cells and subjected to RNA-Seq. On the same day 4 independent WT and HDAC1cKO-HDAC2HET CD4+ T cell batches were prepared. (A) Volcano plot depicts a comparison of global gene expression profiles between activated WT and HDAC1cKO-HDAC2HET CD4+ T cells. 987 and 869 genes were up- and downregulated, respectively, in HDAC1cKO-HDAC2HET CD4+ T cells (FC ≥ 2; FDR ≤ 0.05). (B) Diagram showing top hits of upstream transcriptional regulators (–2 ≥ Z score ≥ 2; P ≤ 0.05), as revealed by Ingenuity Pathway Analysis (QIAGEN Inc.), that are predicted to be “activated” or “inhibited” in HDAC1cKO-HDAC2HET CD4+ T cells. The x axis indicates the Z score. (C) Summary diagrams depict the expression (values shown as fragments per kilobase of transcript per million mapped reads; FPKM) of the indicated genes in activated WT and HDAC1cKO-HDAC2HET CD4+ T cells as determined by RNA-Seq. Each symbol indicates 1 biological sample. Horizontal bars indicate the mean. *P < 0.05, **P < 0.01, and ***P < 0.001 (unpaired 2-tailed Student’s t test). (D) Gene set enrichment analysis (GSEA) plots of Th1-specific and CD8 lineage–specific gene sets (containing 169 and 477 genes, respectively) in activated HDAC1cKO-HDAC2HET CD4+ T cells relative to activated WT CD4+ T cells. The barcodes indicate the location of the members of the gene set in the ranked list of all genes. NES, normalized enrichment score in WT as compared with HDAC1cKO-HDAC2HET population. (E) Heatmap showing fold change (FC) differences of the top 10 up- and downregulated genes (excluding noncoding RNAs) based on log2 FC as well as of selected CTL genes between activated WT and HDAC1cKO-HDAC2HET CD4+ T cells (activated as described in A). The second lane shows FC differences of these genes between activated WT and HDAC1cKO CD4+ T cells (anti-CD3/anti-CD28 for 3 days, restimulated with anti-CD3 for 12 hours as previously described) (17).

