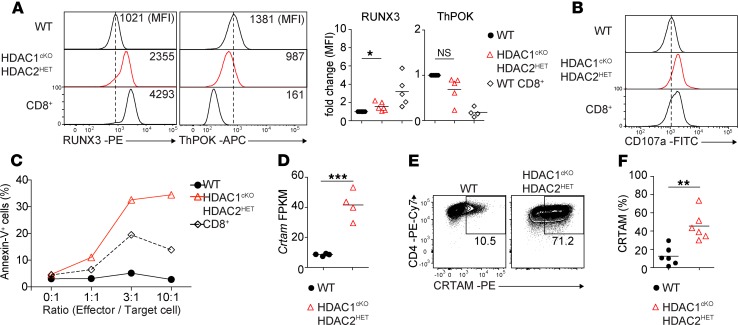
Figure 3. HDAC1cKO-HDAC2HET CD4+ T cells display CTL activity.
(A) Histograms show RUNX3 and ThPOK expression in naive WT and HDAC1cKO-HDAC2HET CD4+ and WT CD8+ T cells activated with anti-CD3/anti-CD28 for 3 days in the presence of IL-2. Diagrams depict the summary of the MFI of RUNX3 and ThPOK expression levels of all independent experiments. WT MFI levels were set as 1, and relative MFI levels in HDAC1cKO-HDAC2HET CD4+ and WT CD8+ T cells are shown. Each symbol indicates 1 mouse. Horizontal bars indicate the mean. (B) Histograms depict CD107a expression on naive WT and HDAC1cKO-HDAC2HET CD4+ and WT CD8+ T cells activated as described in A. (C) Redirected cytotoxicity assay using WT and HDAC1cKO-HDAC2HET CD4+ and WT CD8+ T cells. Effector cells were prepared by activating naive CD4+ and CD8+ T cells with anti-CD3/anti-CD28 for 3 days in the presence of IL-2. On day 3 activated cells were cocultured with P815 target cells at the indicated ratios in the presence of soluble anti-CD3. Target cells were stained 4 hours later with 7-AAD/annexin V and quantified by flow cytometry. Percentage of annexin V+ target cells and the effector/target cell ratio are indicated. (D) Summary diagram indicates FPKM values of Crtam expression in activated WT and HDAC1cKO-HDAC2HET CD4+ T cells as determined by RNA-Seq. (E) Contour plots show CRTAM expression on WT and HDAC1cKO-HDAC2HET CD4+ T cells activated as described in A. (F) Summary of experiments described in E. Diagram depicts the percentages of activated CD4+ T cells expressing CRTAM. (A, D, and F) Each symbol indicates 1 biological sample. Horizontal bars indicate the mean. *P < 0.05, **P < 0.01, and ***P < 0.001 (unpaired 2-tailed Student’s t test). (A, B, and E) Numbers indicate the MFI (A) or the percentage of cells in the respective regions (E). (A and B) The dotted vertical lines indicate the peak of the WT histogram (for MFI). Data are representative of at least 3 (A–C) or 4 (D–F) mice that were analyzed in at least 5 (A), 2 (E and F), or 3 (B and C) independent experiments or 1 (D) experiment.

