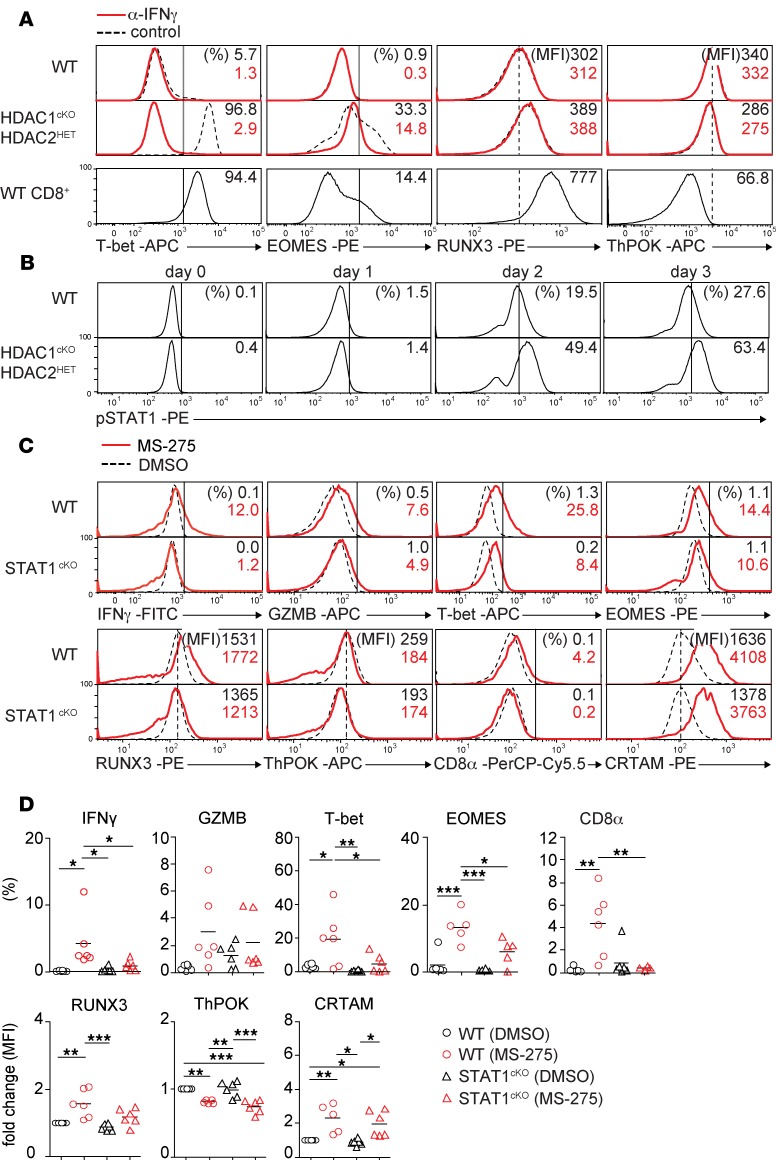
Figure 4. An IFN-γ–JAK1/2–STAT1 signaling pathway is required for CD4+ CTL features in HDAC1cKO-HDAC2HET CD4+ T cells.
(A) Histogram overlays depict T-bet, EOMES, RUNX3, and ThPOK expression in naive WT (upper panel), HDAC1cKO-HDAC2HET CD4+ (middle panel) and WT CD8+ T cells (lower panel) activated with anti-CD3/anti-CD28 for 3 days in the presence (solid red line) or absence (control, dotted black line) of IFN-γ–blocking antibodies (α–IFN-γ). (B) Histograms depict p-STAT1 levels in naive WT and HDAC1cKO-HDAC2HET CD4+ T cells activated with anti-CD3/anti-CD28 in the presence of IL-2 and analyzed by flow cytometry at the indicated time points. (C) Histograms depict IFN-γ, granzyme B, T-bet, EOMES, RUNX3, ThPOK, CD8, and CRTAM expression in naive WT and STAT1cKO CD4+ T cells activated with anti-CD3/anti-CD28 for 3 days. During the last 24 hours before analysis, DMSO (control, dotted black line) and the HDACi MS-275 (solid red line) were added. (D) Summary of experiments described in C. Diagrams depict the percentages of CD4+ T cells expressing the indicated cytokines/transcription factors; or WT (DMSO) MFI levels were set as 1, and relative MFI levels in WT (MS-275) and HDAC1cKO-HDAC2HET (DMSO/MS-275) CD4+ T cells are shown. Each symbol indicates 1 independent biological sample. Horizontal bars indicate the mean. *P < 0.05, **P < 0.01, and ***P < 0.001 (1-way ANOVA analysis followed by Tukey’s multiple-comparisons test). (A–C) Numbers indicate the percentage of cells in the respective quadrants and gates or, as indicated, the MFI. The dotted vertical lines indicate the peak of the WT histogram (for MFI), while the vertical solid lines indicate the gating region for the percentage of cells. Data are representative of at least 5 (A) or 4 (B–D) mice that were analyzed in at least 3 (A, C, and D) or 2 (B) independent experiments.

