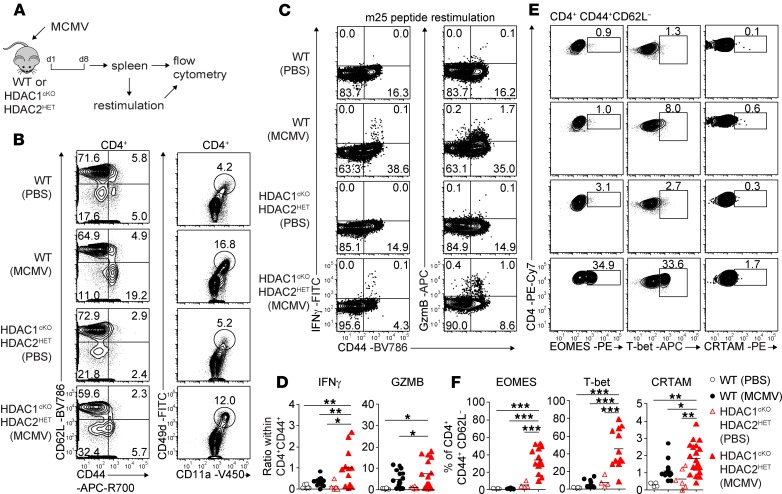
Figure 6. Enhanced induction of CD4+ CTLs in HDAC1cKO-HDAC2HET mice upon MCMV infection.
(A) Experimental strategy: WT and HDAC1cKO-HDAC2HET mice were intraperitoneally injected with 5 × 10⁵ PFU/mouse Δm157-MCMV. Eight days after infection the spleen was isolated, and single-cell suspensions were analyzed by flow cytometry or, prior, restimulated with viral m25 peptide for 4 hours. (B) Flow cytometry analysis of splenocytes isolated from MCMV-infected (or PBS-injected controls) WT and HDAC1cKO-HDAC2HET mice showing CD44, CD62L, CD11a, and CD49d expression on TCRβ+CD4+ cells. (C) Contour plots depict IFN-γ and granzyme B expression in WT and HDAC1cKO-HDAC2HET TCRβ+CD4+ T cells (isolated from MCMV-infected or control mice) restimulated with m25 viral peptide. (D) Summary of experiments described in C. Diagrams depict the ratio of the percentages of either IFN-γ+CD4+CD44hi or granzyme B–positive CD4+CD44hiTCRβ+ cells to the percentages of all CD44hi cells within the TCRβ+CD4+ T cell population isolated from MCMV-infected and control WT and HDAC1cKO-HDAC2HET mice. (E) Contour plots show EOMES, T-bet, and CRTAM expression on TCRβ+CD4+CD44+CD62L– splenocytes isolated from WT and HDAC1cKO-HDAC2HET (MCMV-infected or control) mice. (F) Summary of experiments described in C. Diagrams depict the percentages of TCRβ+CD4+CD44+CD62L– splenocytes expressing EOMES, T-bet, and CRTAM. (B, C, and E) Numbers indicate the percentages of cells in the respective quadrants or gates. (D and F) Each symbol indicates 1 mouse. Horizontal bars indicate the mean. *P < 0.05, **P < 0.01, and ***P < 0.001 (1-way ANOVA analysis followed by Tukey’s multiple-comparisons test). Data are representative (B, C, and E) or show a summary (D and F) of at least 16 (B, C, and E) mice that were analyzed in at least 4 (B, E, and F) or 3 (C and D) independent experiments.

