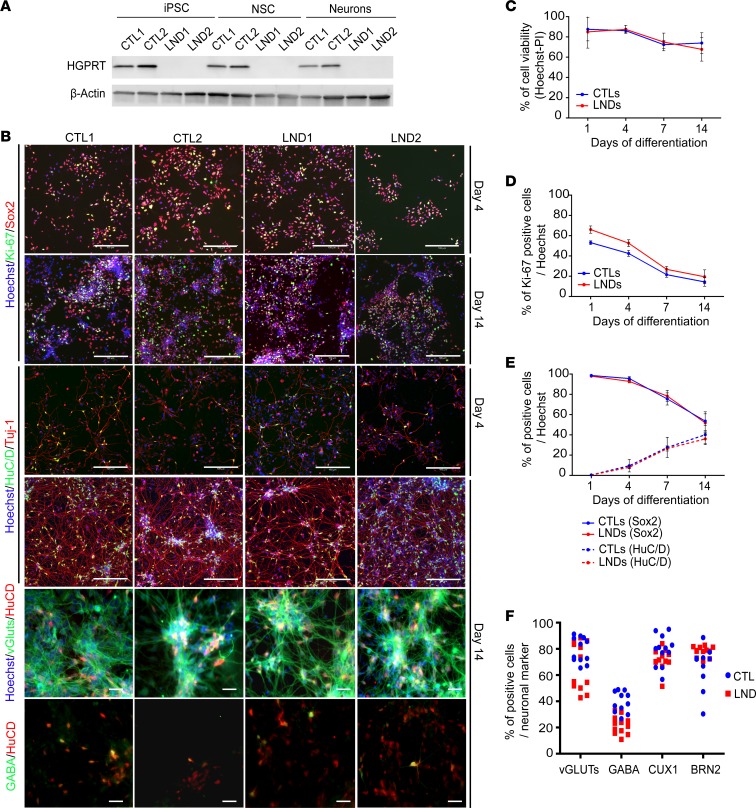
Figure 1. Characterization and phenotypical analysis of iPSCs, NSCs, and cortical neurons derived from control donors and donors with Lesch-Nyhan.
(A) Western blot analysis of HGPRT protein expression in control (CTL) and Lesch-Nyhan disease (LND) iPSCs, NSCs, and cortical neurons. β-Actin was used as a loading control. (B) Representative images of Ki-67 (green) and Sox2 (red) NSC markers and HuC/D (green) and Tuj-1 (red) neuronal markers in control and LND cells on days 4 and 14 of differentiation. Scale bar: 200 μm. vGluts and GABA labeling (green) were combined with HuC/D labeling (red) to identify neuronal subtypes. Scale bar: 20 μm. (C) Quantification of cell viability using a combination of Hoechst and propidium iodide (PI) staining during the process of control (blue lines) or LND (red lines) NSC differentiation. (D and E) Kinetic quantification of the percentage of Ki-67+ cells (D) or HuC/D– and Sox2+ cells (E) during the process of control (blue lines) or LND (red lines) NSC differentiation into postmitotic neurons. (F) Neurons expressing the subtype markers vGLUTs, GABA, CUX1 and BRN2 after 14 days of differentiation in control (blue dots) and LND (red squares) cells. All quantitative results are expressed as the mean ± SD of the 2 control and 2 LND cell lines, with 3 biological replicates per cell line.

