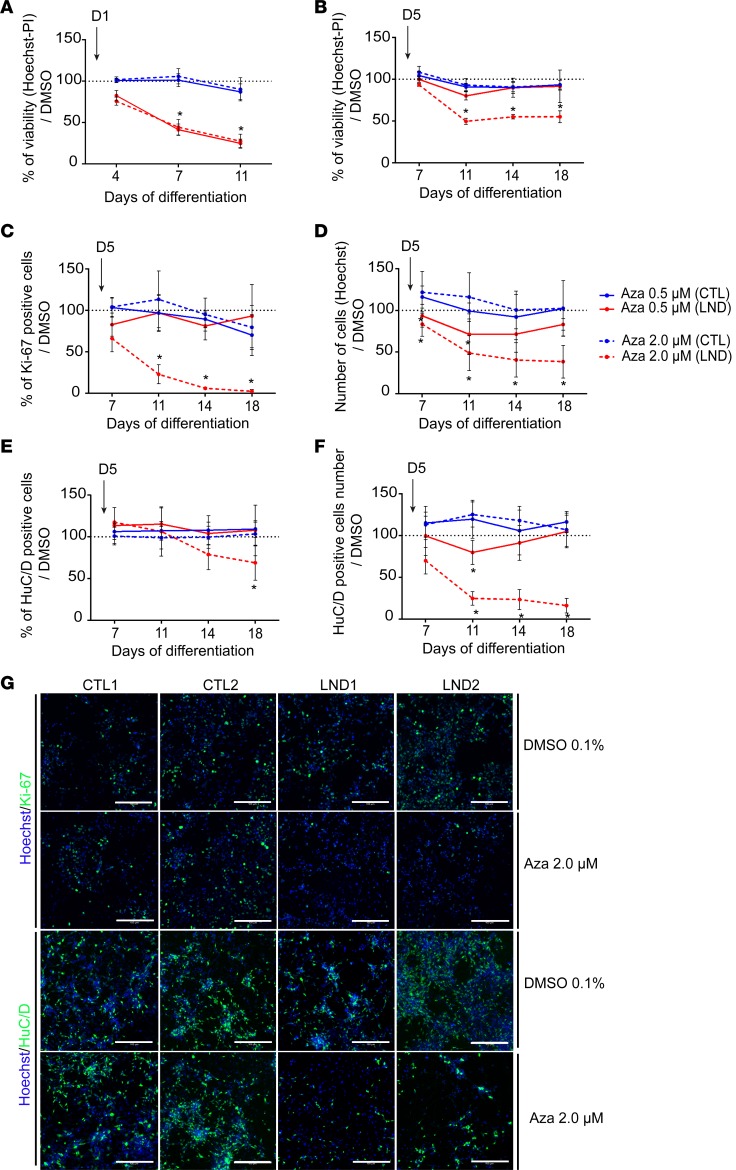
Figure 2. Effect of azaserine treatment on NSCs derived from control individuals or individuals with Lesch-Nyhan disease.
(A) Percentage of cell viability quantified using Hoechst-PI staining after treatment with azaserine starting on day 1 of differentiation (D1) compared with cells exposed to 0.1% DMSO. (B) Percentage of cell viability after azaserine treatment starting on day 5 of differentiation (D5) compared with cells exposed to 0.1% DMSO. (C) Quantification of the percentage of Ki-67+ cells after treatment with azaserine started on day 5 of differentiation compared with cells exposed to 0.1% DMSO. (D) Quantification of the total number of cells quantified using Hoechst nuclear staining after treatment with azaserine started on day 5 of differentiation compared with cells exposed to 0.1% DMSO. (E) Quantification of the percentage of HuC/D+ neurons after treatment with azaserine started on day 5 of differentiation compared with cells exposed to 0.1% DMSO. (F) Quantification of the total number of HuC/D+ neurons after treatment with azaserine started on day 5 of differentiation compared with cells exposed to 0.1% DMSO. (G) Representative images of immunocytochemistry for Ki-67 on day 7 of differentiation and HuC/D on day 14 of differentiation in control (CTL) and Lesch-Nyhan disease (LND) cells exposed to 0.1% DMSO or 2.0 μM azaserine from day 5. Scale bar: 100 μm. All quantitative results are expressed as the mean ± SD of the 2 control (blue lines) and 2 LND (red lines) cell lines, with 4 technical replicates. Azaserine was added at 0.5 (solid lines) or 2.0 μM (dotted lines). *P < 0.01 Holm-Sidak post hoc test.

