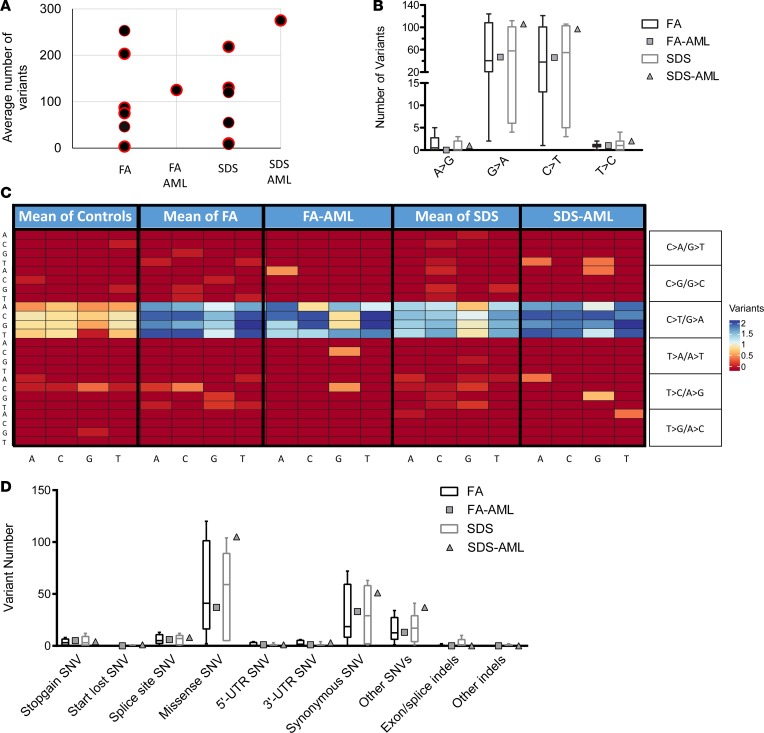
Figure 4. Patterns of single nucleotide and trinucleotide alterations in FA/SDS-associated AML.
(A) Mutation rate in FA/SDS patients with AML or without AML. (B) Percentage of each type of transition mutation across FA/SDS patients with or without AML samples. Percentages of transversions are in Supplemental Figure 19. (C) Trinucleotide heatmap of patients with FA, FA/AML, SDS, and SDS/AML. The trinucleotide mutations are shown with the 5′ base on the y axis and the 3′ base on the x axis. (D) Types of mutations in AML versus non-AML samples. The box plots depict the minimum and maximum values (whiskers), the upper and lower quartiles, and the median. The length of the box represents the interquartile range.

