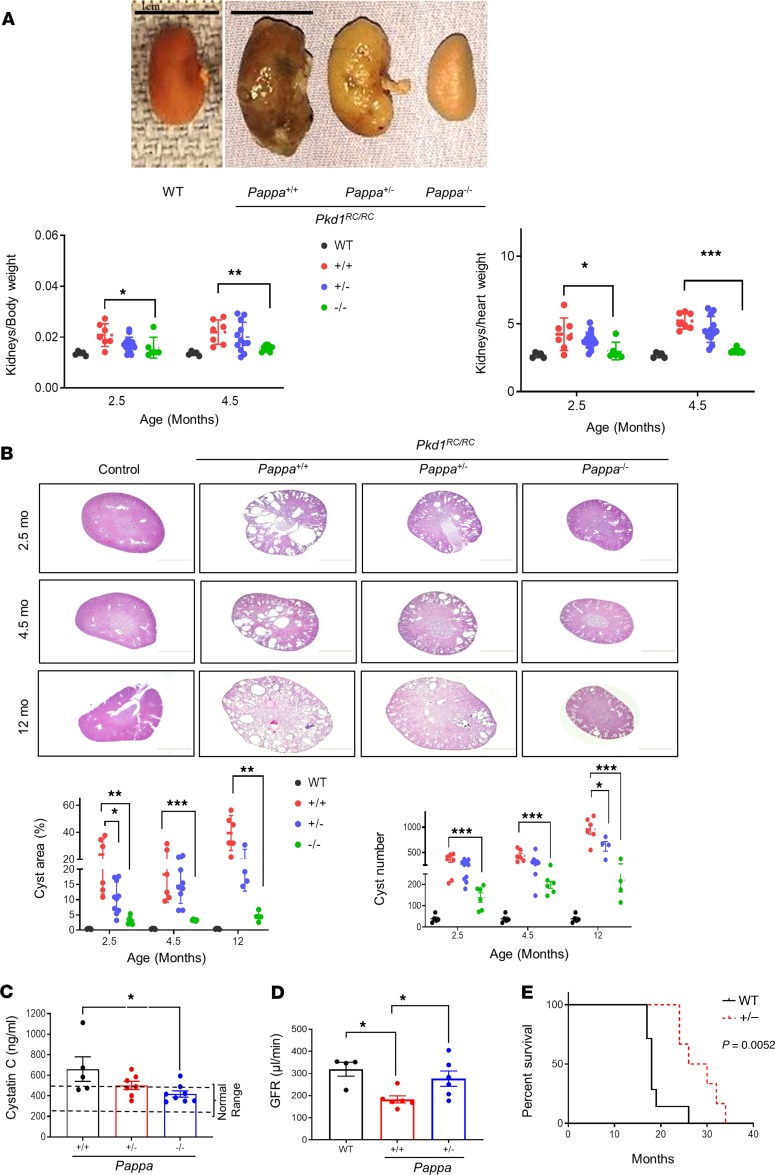
Figure 3. Genetic deletion of Pappa ameliorates ADPKD.
(A and B) Pkd1RC/RC mice that are Pappa+/+, Pappa+/–, or Pappa–/–: (A) Representative gross kidney images at 12 month age, and graphs of kidney/body weight and kidney/heart weight at different ages (n = 5–15). Scale bars: 1 cm. (B) H&E kidney section photomicrographs and graphs of cystic area and cyst number compared with WT mice at different ages (n = 4–10). (C) Serum cystatin C levels in Pkd1RC/RC Pappa mutant mice at 12 months old age (n = 5–8). (D) GFR measurements in WT (n = 4), Pkd1RC/RC Pappa+/+ (n = 6), and Pkd1RC/RC Pappa+/– mice (n = 6) at 11–13 month age. (E) Survival curve of Pkd1RC/RC Pappa mutant mice. Pkd1RC/RC Pappa+/+ mice, n = 7; Pkd1RC/RC Pappa+/– mice, n = 6. Data are presented as mean ± SEM. *P < 0.05, **P < 0.01, ***P < 0.001 by 1-way ANOVA followed by Tukey’s post hoc test for parametric or Kruskal-Wallis test followed by Dunn’s post hoc test for nonparametric distribution or 2-tailed Student’s t test.

