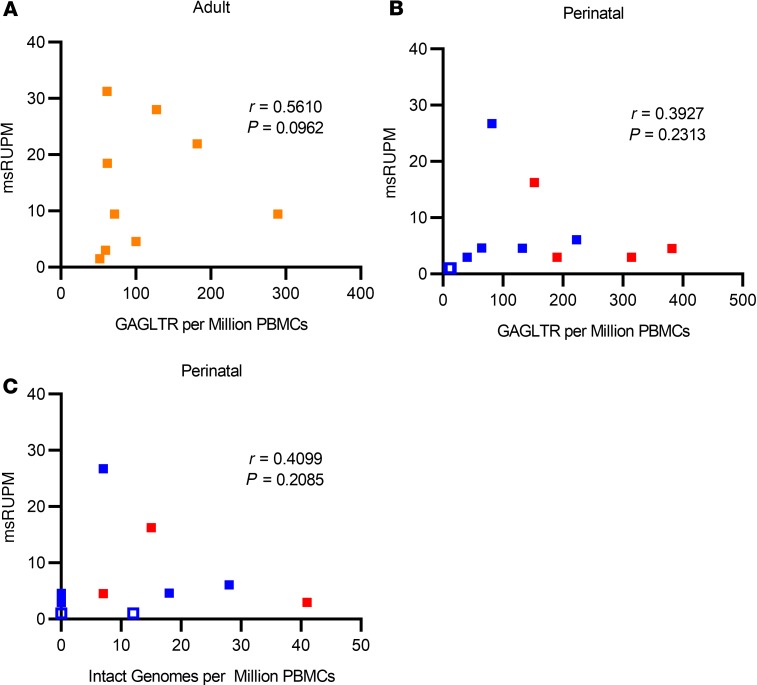
Figure 3. Plot of enhanced TILDA against ddPCR proviral DNA assays.
Multiply spliced RNA producing units per million PBMCs (msRUPM) plotted against GAGLTR copies per million PBMCs in (A) adult (n = 10, orange) individuals and (B) perinatally infected (n = 11, subtype B in blue and non–subtype B in red) individuals. Open data points represent individuals with undetectable msRUPM. (C) msRUPM plotted against double-positive intact proviruses per million PBMCs using IPDA. There was no correlation between TILDA and total DNA ddPCR, or between TILDA and IPDA. Spearman’s rank correlation coefficients and the corresponding P values are shown in the graphs.

