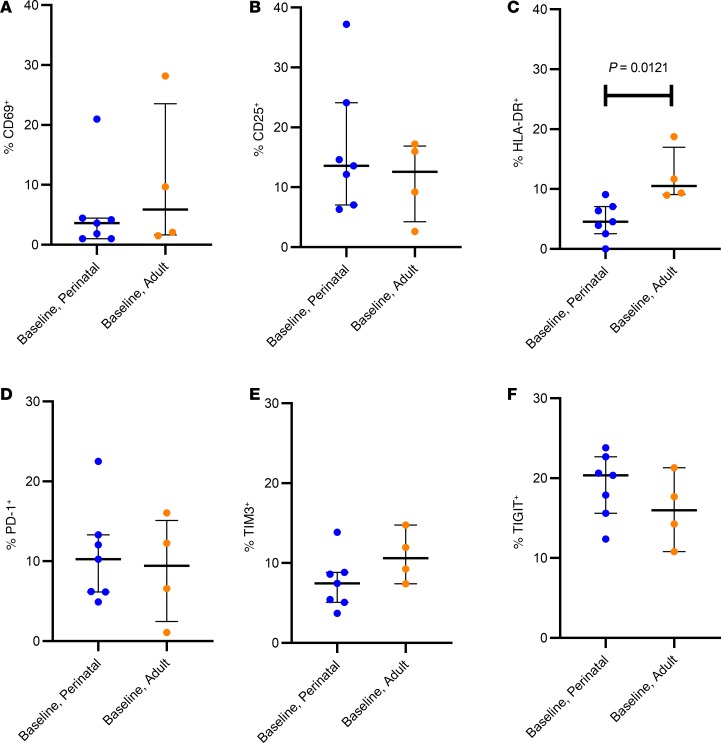
Figure 5. Baseline levels of activation markers.
Comparison of the activation markers (A) CD69, (B) CD25, (C) HLA-DR and the exhaustion markers (D) PD-1, (E) TIM3, and (F) TIGIT between perinatal (n = 7) and adult (n = 4) infections as measured by flow cytometry. Bars represent median and IQRs. The tests for the differences in percent cells with the shown surface markers was conducted using a nonparametric 2-tailed unpaired Mann-Whitney U test.

