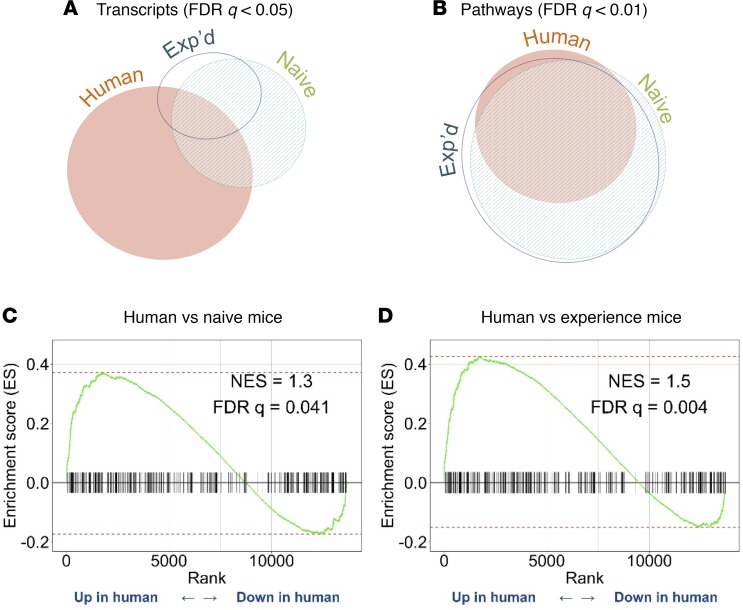
Figure 10. Comparison of mouse and human alveolar macrophage responses to pneumococcal infection.
(A and B) Euler diagrams representing relative sizes and overlap of (A) gene sets or (B) biological pathways that were significantly altered by pneumococcal stimulation of mouse alveolar macrophages that were naive or experienced (data sets collected here) or of human alveolar macrophages from Bewley et al. (40). (C and D) GSEA comparisons of human alveolar macrophage responses to pneumococcus, from Bewley et al. (40), with mouse alveolar macrophage responses to pneumococcus (from data collected here), including alveolar macrophages from mice that were (C) naive or (D) experienced.

