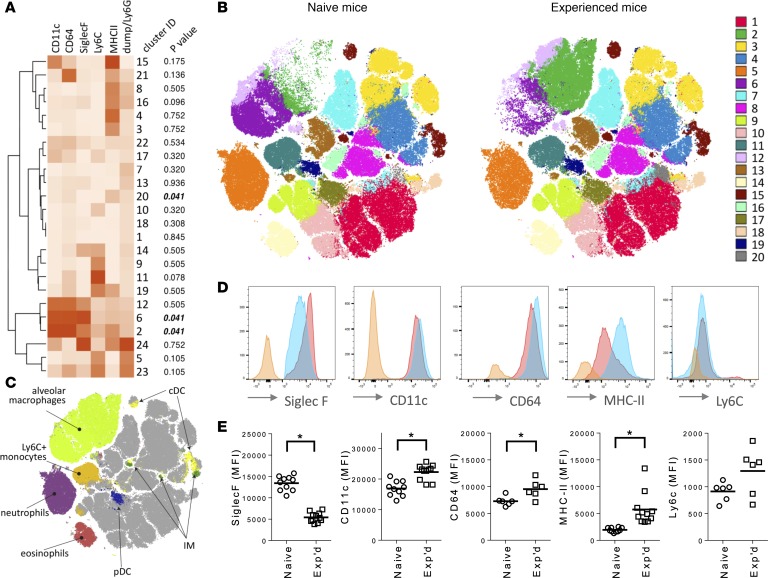
Figure 3. Myeloid cell subsets differentiating experienced mice from naive mice.
For A–C, a flow cytometry data set containing equal numbers of live single-cell CD45+ events from left lung lobes of n = 6 mice in each of the 2 groups (naive or experienced) was phenotyped for relative surface expression of myeloid cell markers CD11c, CD64, Ly6C, Ly6G, MHC II, and SiglecF. (A) Leukocyte subsets in the lungs of naive and experienced mice. Unsupervised clustering of 24 cell subsets (numbered according to cell quantity) was generated using the PhenoGraph algorithm, with heatmap color intensity representing median surface expression for each marker across the entire data set including all cells from all mice. The Wilcoxon rank-sum test with Benjamini-Hochberg multiple-comparisons adjustments was used to compare relative numbers of events (cells) within each cluster between naive and experienced mice, with the FDR-adjusted P value shown for each cluster. (B) Distributions of leukocyte phenotypes in the lungs of naive and experienced mice. The 20 most abundant PhenoGraph clusters based on multidimensional single-cell data (A) were color-coded and plotted on a 2-dimensional (2D) graph using the opt-SNE algorithm for naive and experienced mice. Opt-SNE 2D coordinates are shown on x and y axes. (C) Distributions of manually gated myeloid cells on the opt-SNE map. Myeloid cell-types were binned as in Figure 2 based on expression levels of the surface markers of interest. (D) Expression of surface markers across alveolar macrophages from the lungs of naive or experienced mice, depicted as a representative histogram from a single naive (red) or experienced (blue) mouse. Orange histogram represents matched fluorescence minus one negative control. (E) Comparisons of individual surface markers on alveolar macrophages between naive and experienced mice. MFI values per mouse were plotted for each surface marker, with data collected over 2–3 independent experiments and each data point representing an individual animal and horizontal lines representing group means. Asterisks (*) indicate comparisons reaching statistical significance (P < 0.05) using unpaired 2-tailed Student’s t tests.

