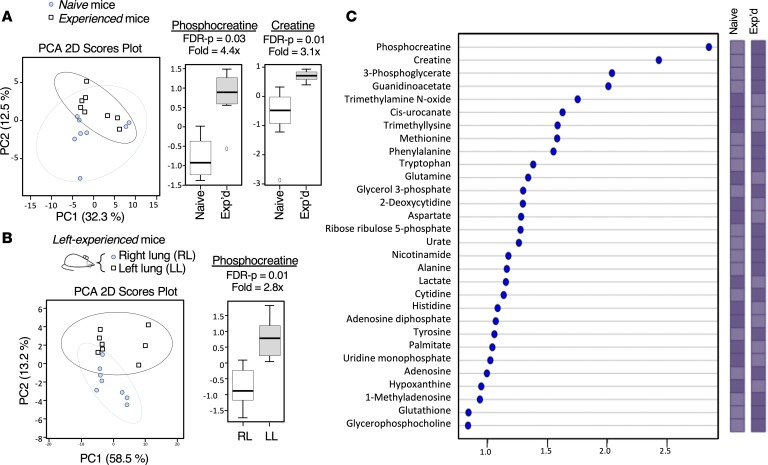
Figure 7. Altered metabolomes of alveolar macrophages after resolution of pneumococcal infections.
(A) Score plot of PCA performed on the LC/MS data of alveolar macrophages lavaged from whole lungs of naive (circle) and experienced (square) mice. The explained variances are shown in parentheses. (B) Score plot of PCA performed on the LC/MS data of alveolar macrophages lavaged selectively from the right (circle) or left (square) lung lobes of left-experienced mice that recovered from prior lobar pneumonias in the left lobe. The explained variances are shown in parentheses. For A and B, features selected by volcano plot that reached the threshold of 2 times fold change and P < 0.01 by 2-tailed Student’s t tests were represented in box plots, log-transformed and normalized to a constant sum. (C) Metabolites identified by PLS-DA and VIP scores (comparison of metabolomes of alveolar macrophages from naive and experienced mice). Significant contribution was considered if VIP > 1. Colored boxes on the right indicate relative concentrations of the corresponding metabolite (elevated in condition with darker box). Two independent experiments with 4 mice per group were performed (n = 8) for both designs.

