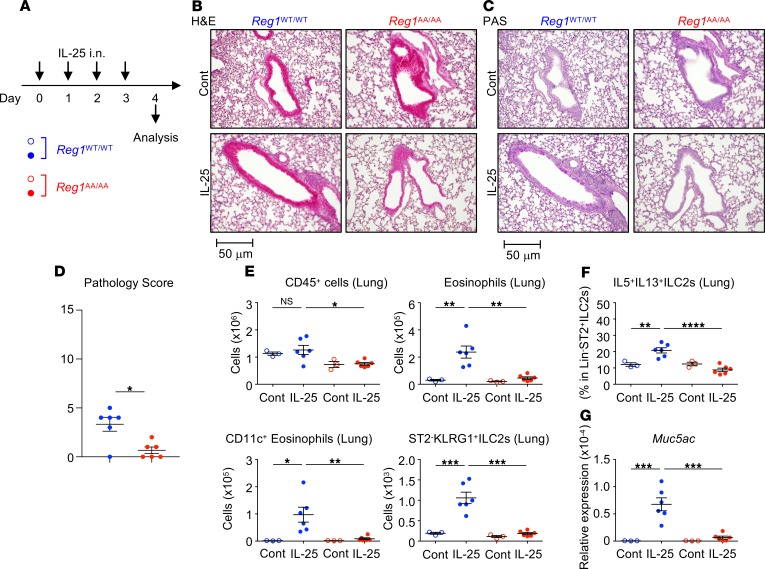
Figure 6. Attenuated IL-25–induced pulmonary inflammation in Regnase-1AA/AA mice.
(A) Experimental schema. Regnase-1WT/WT (blue) and Regnase-1AA/AA (red) mice were i.n. administered with IL-25 (100 ng/dose) or PBS (control; Cont) for 4 consecutive days. (B–D) Histological examination. Representative H&E staining (B) and Periodic acid–Schiff staining (PAS) (C) of lung left lobes (scale bar: 50 mm) and the quantified pathology scores of IL-25–treated mice (D) are shown. (E) Total numbers of CD45+ cells (CD45+ singlet cells), eosinophils (CD45+autofluorescence–CD11b+Siglec-F+), CD11c+eosinophils (CD45+autofluorescence–CD11b+Siglec-F+CD11c+), and ST2–KLRG+ ILC2s (CD45+Lin–CD90.2+ST2–KLRG-1+) in the lung left lobes were quantified by FACS. (F) Lung cells were stimulated with PMA and ionomycin for 4 hours. The percentage of IL-5– and IL-13–producing cells within CD45+Lin–CD90.2+ ILC2s was quantified by intracellular cytokine staining and FACS. (G) mRNA levels for Muc5ac in the lungs were determined by quantitative PCR. Data are representative of 2 independent experiments. Representative images (B and C) and mean (n = 3 for control and n = 6) ± SEM (D–G) are shown. Significance was determined by 2-tailed Student’s t test (D) or 1-way ANOVA followed by Tukey’s test (E–G). *P < 0.05, **P < 0.01, ***P < 0.001, ****P < 0.0001.

