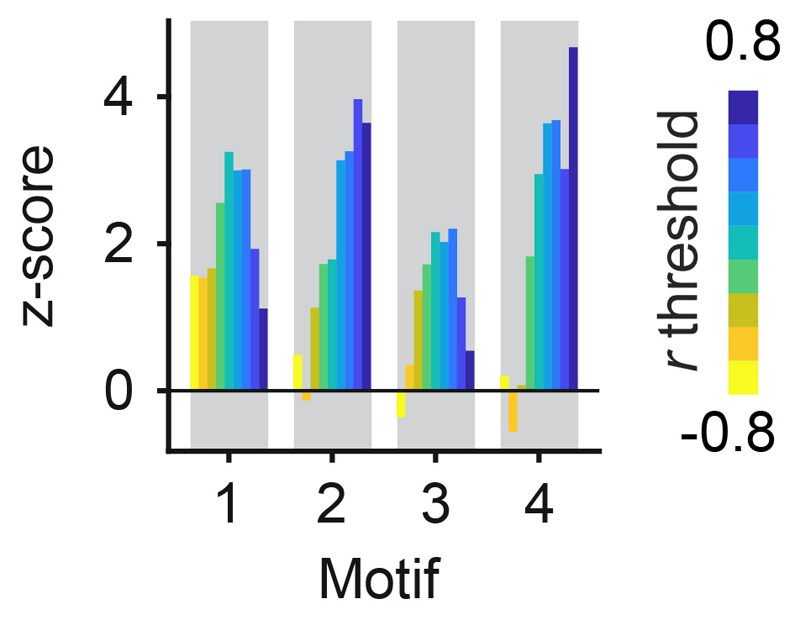
Extended Data Fig. 6. Occurrence of connectivity motifs as a function of tuning correlation.
Z-scores quantify the over-representation of motifs among MC pairs with signal correlations greater than a threshold between -0.8 and 0.8. For each motif, color-coded bars show z-scores for different signal correlation thresholds. Z-scores were determined by comparison against 10,000 shufflings of the tuning correlation matrix as in Fig. 4d.

