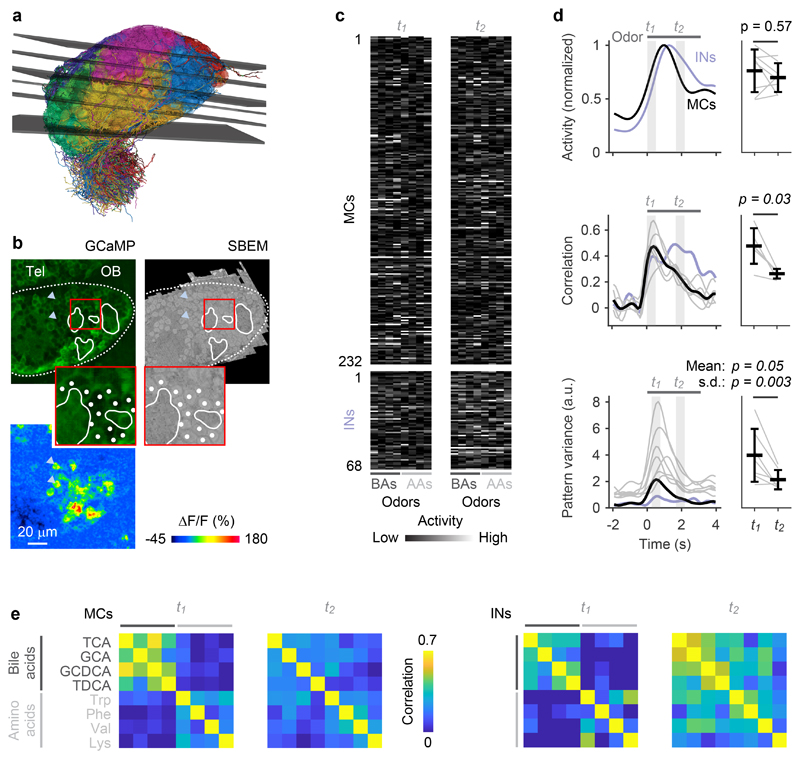
Fig. 2. Odor-evoked population activity in the OB.
a, Mapping of the six optical image planes selected for calcium imaging onto the EM-based reconstructions of neurons. Thickness of planes shows range of drift between trials. b, One optical image plane showing raw GCaMP5 fluorescence (left) and the corresponding oblique slice through the EM image stack (right). Dashed line outlines ipsilateral brain hemisphere; continuous white outlines show glomerular neuropil. Tel, telencephalon; OB, olfactory bulb. Region outlined by the red square is enlarged; white dots depict somata in corresponding locations. Bottom left: fluorescence change evoked by an odor stimulus in the same field of view. Arrowheads depict locations of two responsive somata in different images. The alignment of EM images with optical images was repeated in all n = 6 image planes with similar results. c, Activity (deconvolved calcium signals) of MCs (n = 232) and INs (n = 68) in response to four bile acids (BAs) and four amino acids (AAs) during two time windows, t1 and t2. d, Left: time courses of odor-evoked activity (n = 8 odors), pattern correlation (Pearson; n = 6 bile acid pairs) and pattern variance (n = 8 odors). Activity was determined by low-pass filtering and deconvolution of somatic calcium signals. Horizontal bar indicates time of odor stimulation. Black: mean measures across MCs. Gray: individual odors (variance) or odor pairs (correlation). Light blue: mean measures across INs. Correlation was measured only between activity patterns evoked by bile acids because patterns evoked by amino acids were dissimilar already at response onset. Right: Mean measures for MCs during t1 and t2 (activity, correlation, mean variance: two-sided Wilcoxon rank-sum test; s.d. of variance: F-test with df1 = df2 = 7 degrees of freedom; F = 14.0). Black markers and error bars show mean ± s.d.; gray lines show individual datapoints. e, Matrices showing Pearson correlations between activity patterns across MCs (left; n = 232) and INs (right; n = 68) at t1 and t2. Odors: TCA, taurocholic acid; GCA, glycocholic acid; GCDCA, glycochenodeoxycholic acid; TDCA, taurodeoxycholic acid; Trp, tryptophan; Phe, phenylalanine; Val, valine; Lys, lysine.

