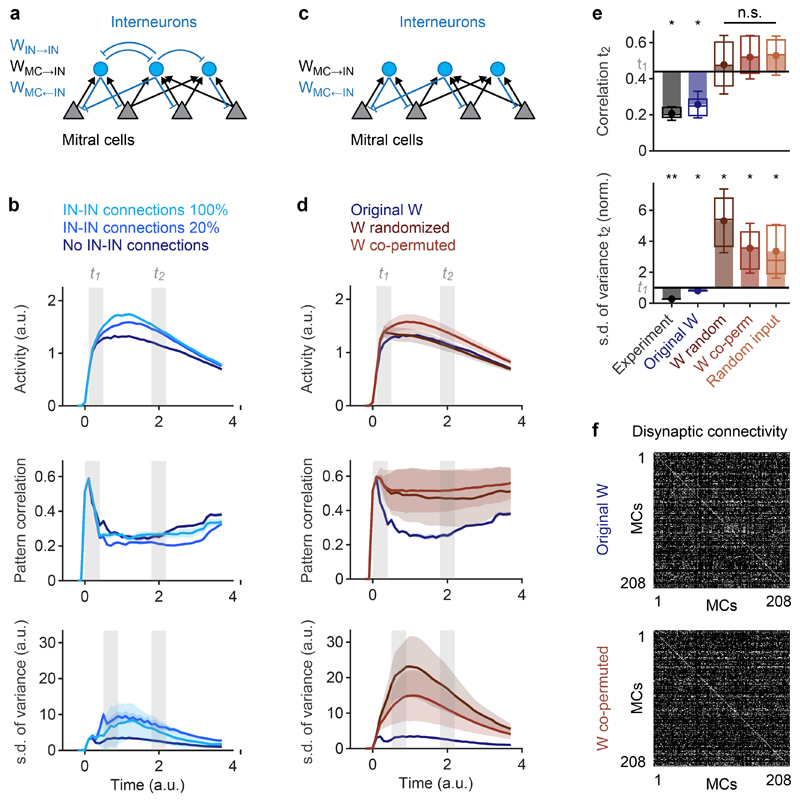
Fig. 3. Whitening depends on connectivity.
a, Architecture of the simulated network. Sensory input was targeted to MCs but not to INs. b, Time courses of simulated odor-evoked activity, pattern correlation (Pearson) and the s.d. of pattern variance obtained with different IN-IN connection strengths (100%, 20%, 0%). 100% corresponds to the same strength as MC←IN connections. Measures were calculated across all n = 208 MCs. c, Simulated network without IN-IN connections. d, Time courses of simulated activity, pattern correlation (Pearson) and s.d. of pattern variance obtained with different wiring diagrams (no IN-IN connections). Measures were calculated across all n = 208 MCs. Blue: original wiring diagram obtained by circuit reconstruction. Dark red: fully randomized connectivity. Light red: co-permutation of feed-forward (MC→IN) and feed-back (MC←IN) connectivity. Shaded areas show s.d. across permutations. e, Pattern correlation and s.d. of pattern variance at t2. Horizontal black lines show mean experimental values at t1; s.d. of pattern variance is normalized to the experimental value at t1. Statistical comparisons of correlation and s.d. of variance were performed using a two-tailed t-test and an F-test, respectively. Dots show means, error bars show s.d., filled bars show difference to corresponding values at t1, box plots show median, 25% percentile, and 75th percentile. For experimental results and simulations using the reconstructed wiring diagram, variability was measured across odor pairs (correlation; bile acids only; n = 6) or individual odors (s.d. of variance; n = 8). Significance tests compare values at t2 to experimental values at t1 (correlation: two-sided Wilcoxon rank-sum test; s.d. of variance: F-test with df1 = df2 = 7 degrees of freedom). For other simulation results, variability was measured across n = 50 different network simulations (repetitions). Significance tests compare repetitions to the mean value observed experimentally at t1 (two-tailed t-test with 49 degrees of freedom). *, p < 0.05; **, p < 0.01; ***, p < 0.001; n.s., not significant. P-values: correlation: 0.03, 0.04, 0.81 (t = 0.23), 0.51 (t = 0.66), 0.42 (t = 0.81); s.d. of variance: 0.003 (F = 14.0), 0.04 (F = 5.2), 0.01 (t = 2.56), 0.03 (t = 2.19), 0.03 (t = 2.18). f, Top: disynaptic connectivity matrix between all MCs included in activity measurements and simulations (WMC→IN * WMC←IN; Methods). Grayscale represents number of disynaptic MC-IN-MC connections (normalized). Bottom: example of a disynaptic connectivity matrix with the same order of MCs after co-permuting WMC→IN and WMC←IN.

