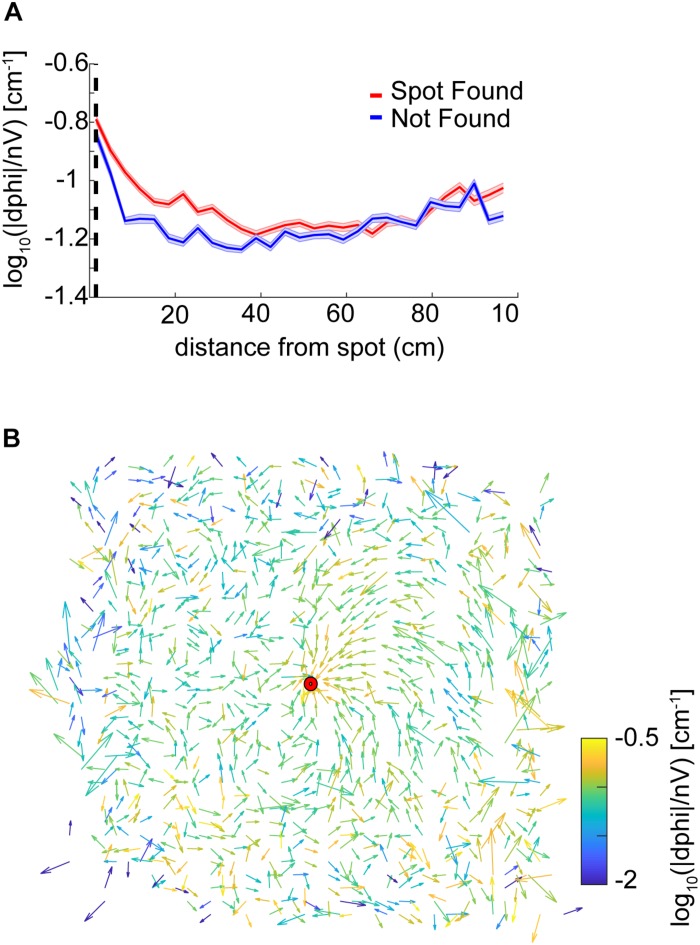
FIGURE 4.
Analysis of casting amplitude using curvature. (A) Unsigned curvature of the nose was computed as a measure of casting amplitude (see section “Materials and Methods”) and averaged across successful trials (red line = mean ± SEM). Casting increased as mice approached the odor spot (ANOVA; p = 1.21E−64, F = 42, df = 8). (B) The approach vector for successful trials are the vector components of the circular mean of the nose-to-body orientation (angle α in Figure 3E) after centering position data at the odor spots. Vectors are normalized by the circular standard deviation. Color indicates the curvature measure for casting at that point. Most trajectories approach the spot from the northeast.

