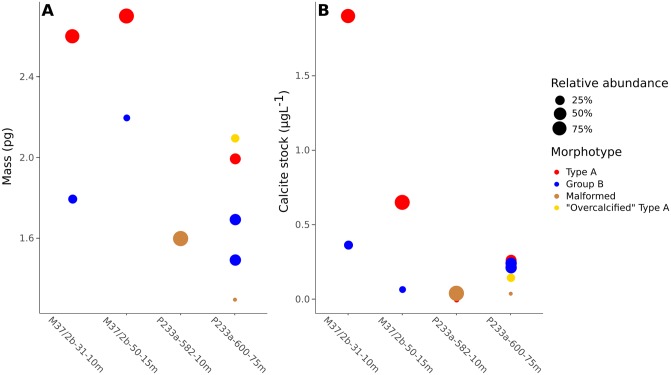
Fig 14.
A: Mean coccolith mass of individual E. huxleyi morphotypes estimated using a volumetric model (Eq 2). B: Calcite production by individual E. huxleyi morphotypes. Calcite concentration was estimated using measured coccolith mass in A, cell density, and assuming 23 coccoliths per cell. Colour of circle denotes the morphotype, while the size of the circle indicates the relative abundance of the morphotype in each sample. Note that in sample P233a-600-75m Type A and Group B coccoliths had each two possible mean coccolith thickness values obtained from the MCMC model. Therefore, two alternative coccolith mass and calcite concentration estimates are given for each of these morphotypes.

