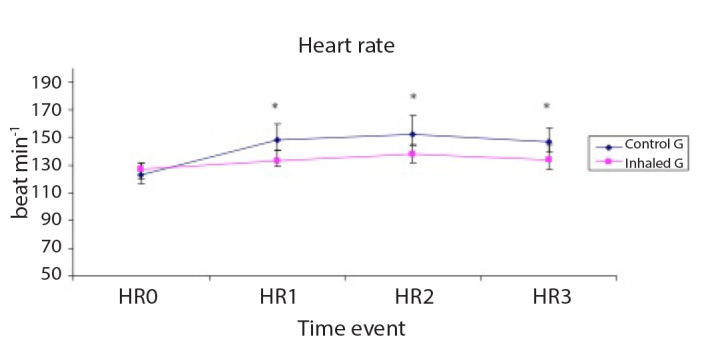
Figure 1.

Heart rate (HR, beat min−1) of the studied groups
Data are expressed as mean±SD. *p<0.05 is significant compared with the control group.

Heart rate (HR, beat min−1) of the studied groups
Data are expressed as mean±SD. *p<0.05 is significant compared with the control group.