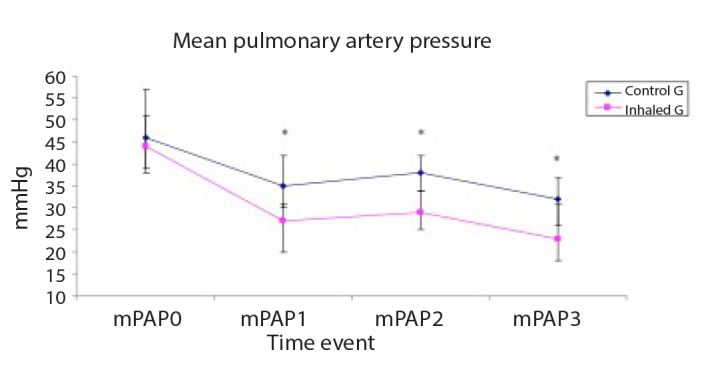
Figure 3.

Mean pulmonary artery pressure (mPAP, mmHg) of the studied groups
Data are expressed as mean±SD. *p<0.05 is significant compared with the control group.

Mean pulmonary artery pressure (mPAP, mmHg) of the studied groups
Data are expressed as mean±SD. *p<0.05 is significant compared with the control group.