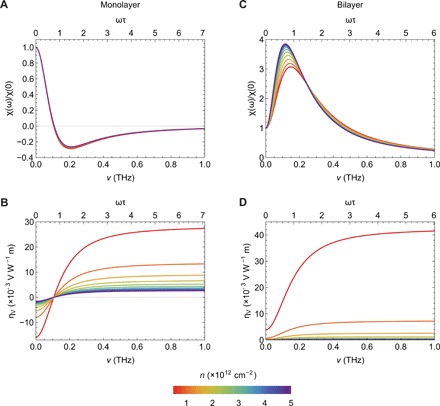
Fig. 3. Second-order response for graphene heterostructures and multilayers.

(A and B) Second-order DC response for monolayer and (C and D) bilayer graphene. The second-order conductivity χ is shown in (A) and (C), and the reduced voltage responsivity ηV is shown in (B) and (D). The carrier density n is changed from 0.5 × 1012 cm−2 (red) to 5 × 1012 cm−2 (purple). We use the values v = 0.94 × 10⁶ m/s, Δ = 15 meV, and τ = 1.13 ps for the monolayer case; and Δ = 50 meV and τ = 0.96 ps for the bilayer case, from transport, infrared spectroscopy, and scanning tunneling microscopy/spectroscopy measurements (37, 47–51). For the bilayer case, λ = (2m)−1 is determined by the effective mass m ≈ 0.033 me (me, electron mass) and v ≈ 1 × 10⁵ m/s (52, 53). See also the Supplementary Materials for details.
