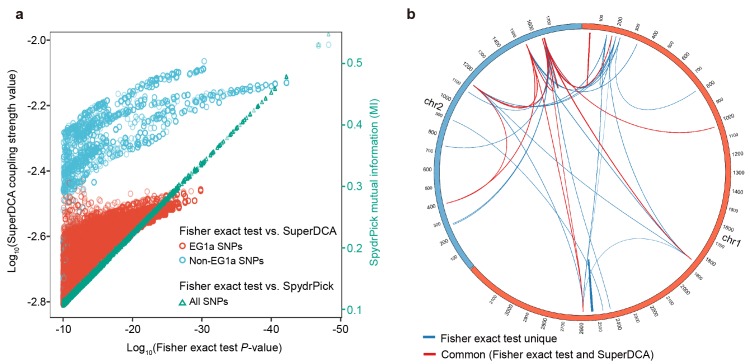
Figure 7. Comparison with other epistasis detection methods.
(a) Correlation between Fisher exact test P value and SuperDCA coupling strength (red and blue for ecogroup 1a (EG1a) and non-EG1a SNPs, respectively), and between Fisher exact test P value and SpydrPick mutual information (green). (b) Overlap of strong linked SNP sites detected by Fisher exact test (p<10−10, excluding EG1a SNPs) and SuperDCA (coupling strength >10-2.2). Red for interacted SNP pairs detected by both methods, blue for SNP pairs detected only by Fisher exact test.


