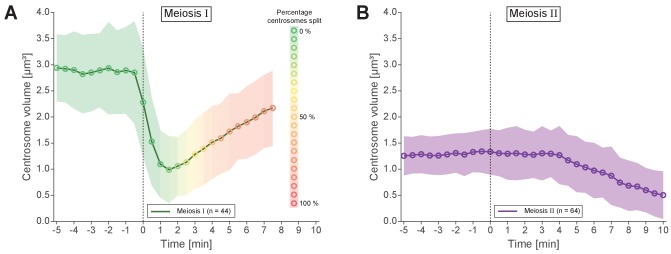
Appendix 1—figure 3. Analysis of centrosomal volumes in meiosis I and II.
(A) Plot showing centrosome volume in meiosis I over time. The 3D volume was measured in worms expressing γ-tubulin::GFP and histone H2B::mCherry. For each dataset a fixed threshold was defined to segment the outer border of the centrosome. The mean volume is plotted as a green line for unsplitted centrosomes and shown as an orange to red line for splitted centrosomes. The percentage of splitted centrosomes is indicated by this color change. For splitted centrosomes, the sum of both separated centrosomes was determined (n = 44). The standard deviation is depicted as a shaded area. (B) Centrosome volume over time (purple line) in meiosis II (n = 64).

