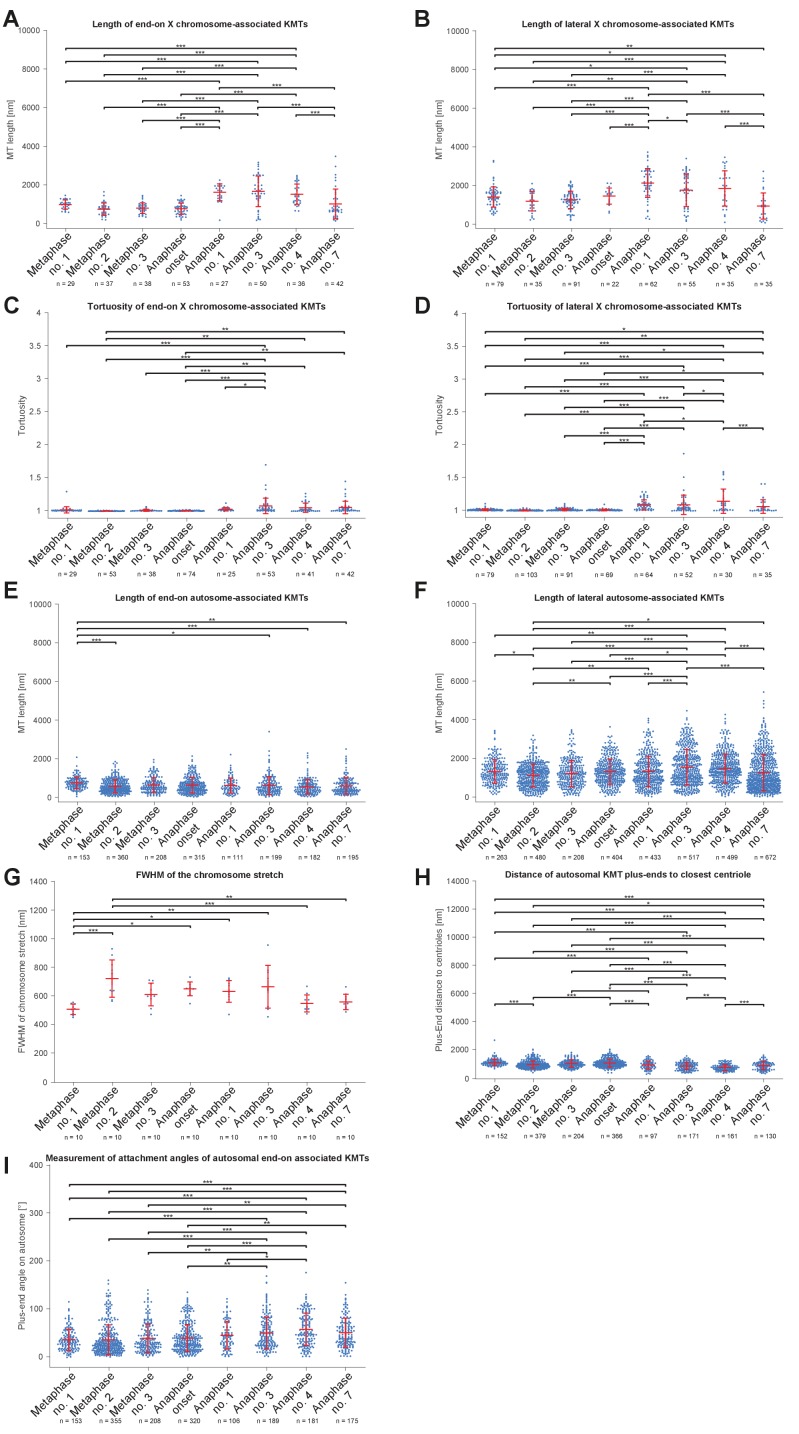
Appendix 1—figure 5. Comparison of microtubule length distributions and spindle geometry (ANOVA).
(A) Length of end-on X chromosome-associated kinetochore microtubule for each tomographic data set as shown in Figure 5A. The mean, the standard deviation and single measurements for each meiotic stage are given. Results of a one-way analysis of variance (ANOVA) of all data sets against each other are shown. Level of significance: * is p<=0.05; ** is p<=0.01; and *** is p<=0.001. (B) Length of lateral X chromosome-associated kinetochore microtubules corresponding to Figure 5B. (C) Tortuosity of end-on X chromosome-associated kinetochore microtubules corresponding to Appendix 1—figure 6B. (D) Tortuosity of lateral X chromosome-associated kinetochore microtubules corresponding to Appendix 1—figure 6B. (E) Length of end-on autosome-associated kinetochore microtubules corresponding to Figure 7G. (F) Length of lateral autosome-associated kinetochore microtubules corresponding to Figure 7H. (G) FWHM of the chromosome stretch for each meiotic stage corresponding to Figure 8B. (H) Distance of autosomal kinetochore microtubule plus-ends to closest centriole for each meiotic stage corresponding to Figure 8D. (I) Measurement of attachment angles of autosomal end-on associated kinetochore microtubules as given in Figure 8F.

