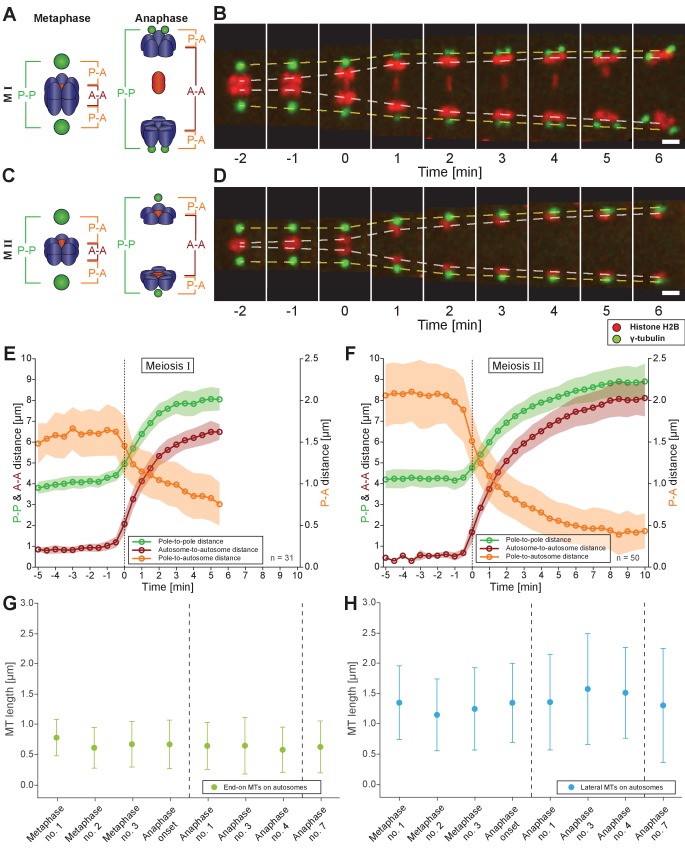
Figure 7. Spermatocyte meiotic spindles display both anaphase A and B movement.
(A) Schematic representation of metaphase and anaphase during meiosis I. Centrosomes are in green, autosomes in blue, and the univalent X chromosome in red. The pole-to-pole (P-P, green), autosome-to-autosome (A-A, red), and both pole-to-autosome distances (P-A, orange) are indicated. (B) Time series of confocal image projections of a spindle in meiosis I with centrosomes labeled with γ-tubulin::GFP (green) and chromosomes with histone H2B::mCherry (red). The separation of the centrosomes (yellow dashed line) and the autosomes (white dashed line) over time is indicated. Anaphase onset is time point zero (t = 0). Scale bar, 2 µm. (C) Schematic representation of metaphase and anaphase during meiosis II. (D) Separation of centrosomes and autosomes in meiosis II as in (F). Scale bar, 2 µm. (E) Quantitative analysis of autosome and centrosome dynamics in meiosis I show a decrease in pole-autosome distance that is characteristic of anaphase A. Anaphase onset is time point zero (t = 0). The mean and standard deviation is given (circles and shaded areas). (F) Quantitative analysis of autosome and centrosome dynamics in meiosis II. (G) Length distribution of end-on autosome-associated kinetochore microtubules at different stages of meiosis I. Dots show the mean, error bars indicate the standard deviation. Dashed lines indicate a grouping of the spindles according to the meiotic stages: metaphase/anaphase onset, mid anaphase and late anaphase (see also Appendix 1—figure 2). (H) Length distribution of laterally autosome-associated kinetochore microtubules at different stages of meiosis I.

