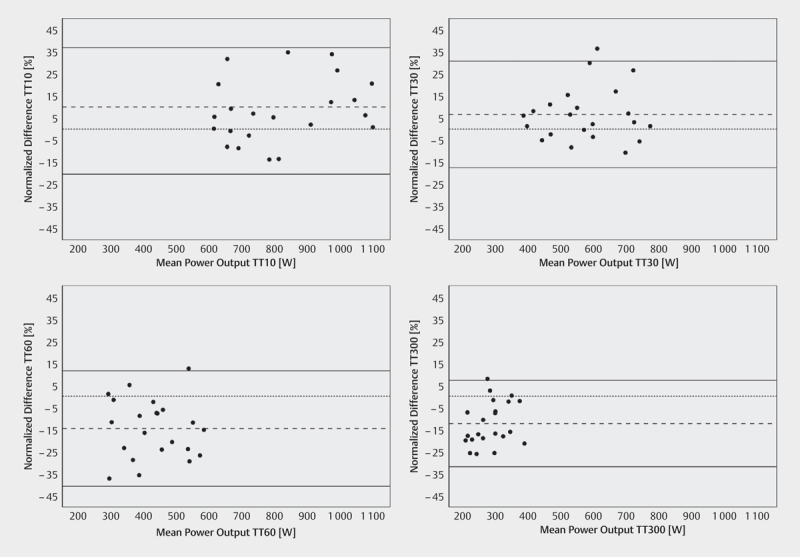
Fig. 2.

Normalized difference in power output between the Power Profile Test and the XCO race (PPT-Race); n=22 for each sprint/maximal effort. The dotted line represents the exact match (Y=0). The dashed line represents the mean bias and solid lines the 95% limits of agreement.
