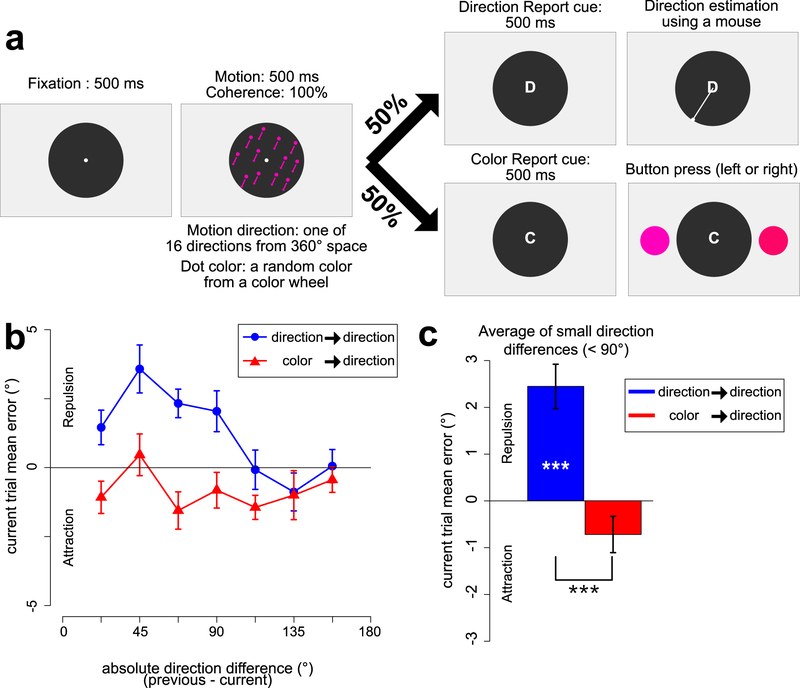
Figure 1.
Experiment 1 task and results. a. Sequence of stimuli. On each trial, participants saw a random dot kinematogram (RDK) drawn in colored dots, with a random direction of motion and a random color. The line segments shown in the figure represent the direction of motion and were not visible. After the RDK, a post-cue indicated which feature dimension – direction of motion or color – should be reported. When the direction cue (D) was presented, participants continuously adjusted orientation of a white response line using a mouse to report the direction of motion of the RDK. When the color cue (C) was presented, two test colors were presented and the participant pressed a key to report the color of the RDK. b. Mean response error for the direction report as a function of the absolute direction difference between the current and previous trial, plotted separately for trials preceded by a direction report and for trials preceded by a color report. Positive values indicate that the current-trial direction report was biased away from the direction of the previous trial, and negative values indicate that the current-trial direction report was biased toward the direction of the previous trial. c. Mean response error for the direction report, averaged across small direction differences (22.5°~67.5°), plotted separately for trials preceded by a direction report and trials preceded by a color report. Error bars indicate ±1 SEM. *** = p <.001

