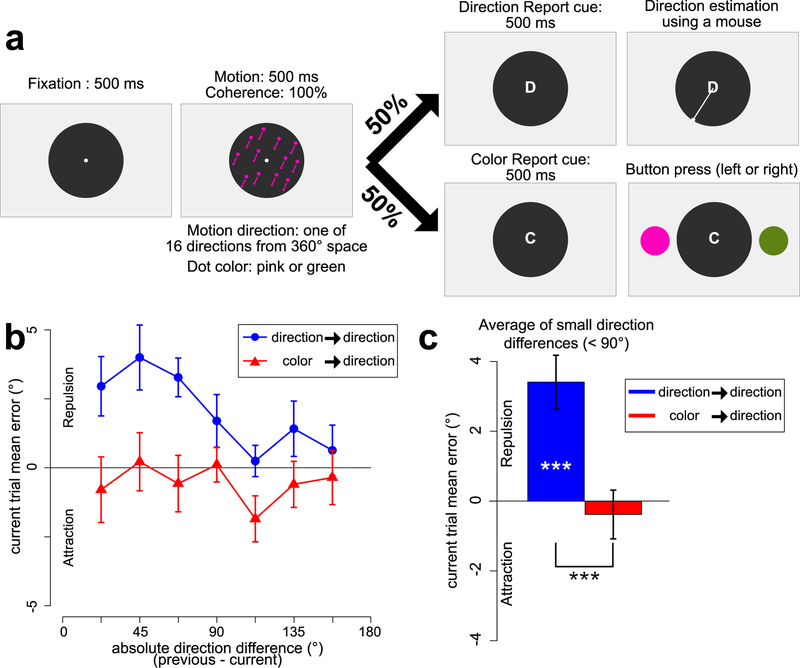
Figure 2.
Experiment 2 task and results. a. Sequence of stimuli. The dots were always either pink or green, and the test options were also pink and green. b. Mean response error for the direction report as a function of the absolute direction difference between the current and previous trial, plotted separately for trials preceded by a direction report and trials preceded by a color report. c. Mean response error for the direction report, averaged across small direction differences (22.5°~67.5°), plotted separately for trials preceded by a direction report and trials preceded by a color report. Error bars indicate ± 1 SEM. *** = p <.001

