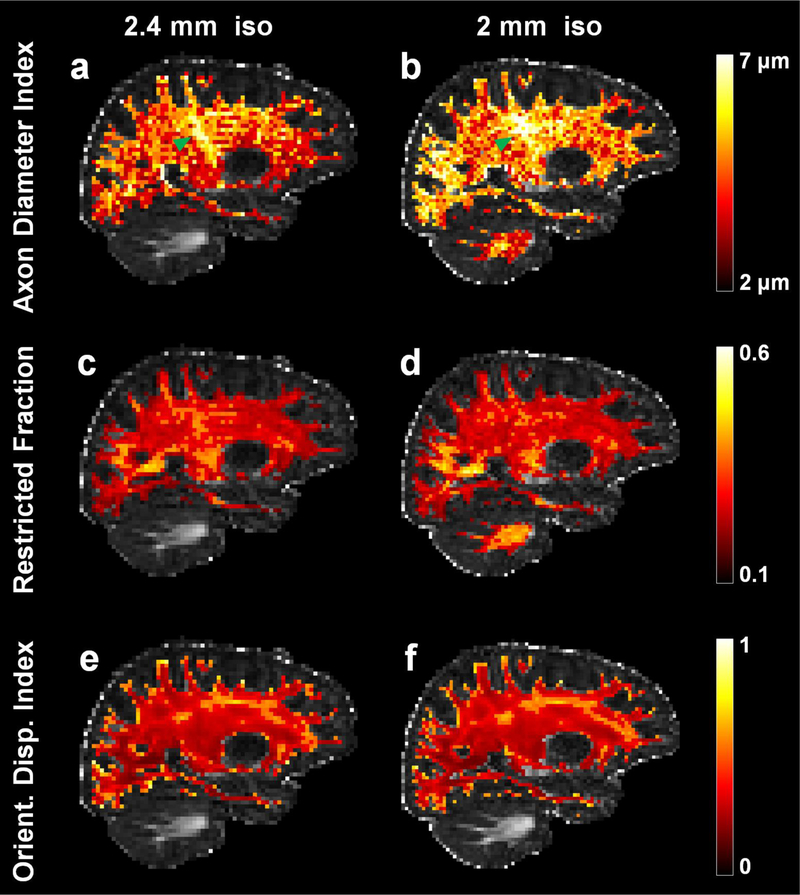
Fig. 2.
Representative sagittal slices through the right corticospinal tract (highlighted by green arrowheads) from the maps of axon diameter index (a, b), restricted volume fraction (c, d), and orientation dispersion index (ODI) (e, f) at 2 mm (a, c, e) and 2.4 mm (b, d, f) isotropic resolution in separate scan sessions in the same healthy subject

