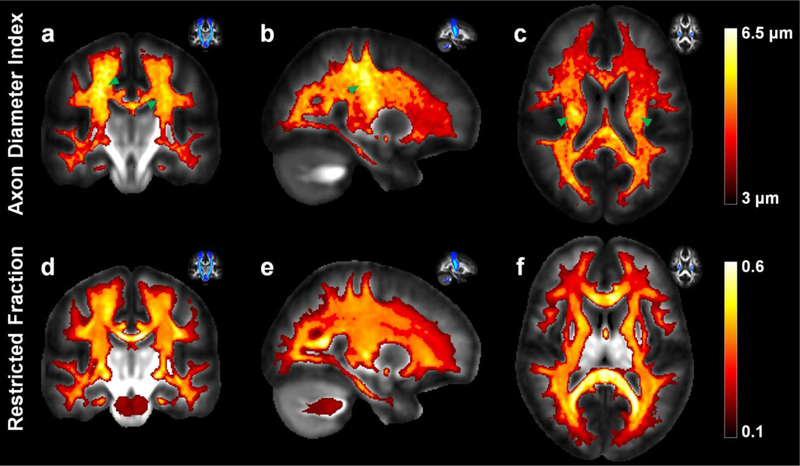
Fig. 3.
Group averaged maps of (a–c) axon diameter index estimates and (d–f) restricted volume fraction estimates averaged across 20 healthy subjects, shown in coronal (a, d), sagittal (b, e) and axial views (c, f). The location of the corticospinal tract is highlighted by the green arrowheads and displayed in the probabilistic tractography maps in the top left corner of each sub-figure for reference

